Kubernetes Requests vs Limits: Best Practices & Examples
Kubernetes Cost Optimization: Best Practices for Continuous Efficiency
Chapter 3
Most production Kubernetes clusters prioritize stability over efficiency. To avoid CPU throttling and out-of-memory errors, teams often set pod requests conservatively and increase resource limits to handle peak traffic. For cost optimization, adjusting pod-level resources is a key first step, but relying on this alone misses other savings.
If you review past cluster bills, you’ll find the biggest expenses rarely come from a single massive resource. Instead, they often result from overlapping autoscaling systems that resolve complex scaling issues by simply throwing idle capacity at the problem. For example, the Horizontal Pod Autoscaler (HPA) is a significant source of this waste. When applications experience reduced requests due to scaling latency or slow startup times, teams often lower the HPA target utilization threshold to 60%, 50%, or 40%. This misconfiguration causes the HPA to scale out many underutilized replicas, causing the cluster autoscaler to provision unnecessary nodes.
This guide covers best operational practices for transitioning from defensive provisioning to continuous efficiency. It explains how to establish utilization baselines, continuously right-size workloads, adjust autoscaling triggers, and optimize persistent storage. Finally, we discuss how to adapt these practices across environments while managing automated changes with strict guardrails.
Summary of Kubernetes cost optimization best practices
| Practice | Description |
|---|---|
| Audit before you optimize. Measure over-provisioning first | Measure request-to-usage ratios over an extended window, such as 7–14 days. Identify baseline defensive over-provisioning (typically 50–70% idle capacity) before updating any configurations. |
| Right-size workloads and nodes continuously | Automate pod-level rightsizing using predictive scaling to prevent native VPA/HPA eviction loops. Always optimize pod requests before tuning node provisioners. |
| Fix autoscaling order, then use Spot deliberately | Align pod requests and HPA triggers prior to adopting Spot capacity. Route stateless, burst-tolerant workloads to preemptible nodes using advisory automation to keep them reversible. |
| Match provisioning patterns to your managed Kubernetes service | Update autoscaler settings (like scale-down-utilization-threshold) to your specific cloud provider (e.g., GKE NAP vs. EKS Karpenter). Route workloads using exact CPU/VRAM hardware mapping rather than default instance families. |
| Allocate spend by namespace and connect it to monitoring | Enforce ResourceQuotalimits and strict label standards to isolate multi-tenant costs. Use OpenCost for visibility, but couple it with automated rightsizing engines to actively reduce the bill. |
| Treat storage as its own optimization layer | Execute continuous PromQL audits to catch silent capacity leakage. Detect orphaned PVs and oversized PVCs using peak-usage time windows rather than single-point-in-time snapshots. |
| Govern automation with policy guardrails and FinOps discipline | Restrict automated changes using strict namespace scoping and opt-out annotations. Implement recurring FinOps showback reviews and mandate a verifiable audit trail for all scaling actions. |
Spend less time optimizing Kubernetes Resources. Rely on AI-powered Kubex - an automated Kubernetes optimization platform
Free 30-day TrialAudit before you optimize: Measure over-provisioning first
Begin by establishing a utilization baseline to avoid risking resource starvation or throttling during peak periods.
Practical cost management begins by measuring per-container request-to-usage ratios over a realistic timeframe, typically seven to fourteen days. This window captures real-world usage patterns and fluctuations.
Example measurement queries
Query your metrics stack (e.g., Prometheus) to identify the gap between requested and consumed resources. For example, the below PromQL query identifies specific containers that are consistently using less than 30% of their requested CPU over a seven-day window:
avg_over_time(
rate(container_cpu_usage_seconds_total{namespace="production", container!="", container!="POD"}[5m])[7d:1h]
) / on(namespace, pod, container)

avg_over_time(
kube_pod_container_resource_requests{resource="cpu",namespace="production"}[7d:1h]
) < 0.3
This query calculates each container’s (in productionnamespace) average CPU utilization over seven days by dividing actual usage by requested allocation. The on(namespace, pod, container)clause joins data with metrics across Prometheus exporters. The < 0.3 threshold filters for containers using less than 30% of their requested capacity, showing over-provisioned workloads.
Benchmarking existing inefficiencies
Defensive provisioning to prevent throttling or OOM errors often leads to over-allocation. You might add safety buffers for worst-case scenarios, leaving 50% to 70% idle capacity. Use this 50%-70% range as a benchmark for evaluating your cluster’s initial efficiency. If your idle capacity is in this range, you have standard defensive over-provisioning.
When establishing a baseline, distinguish between cost allocation and diagnostic audits. Open-source tools like OpenCost assign expenses to teams, namespaces, or services. A diagnostic audit that compares requested capacity with historical utilization directly identifies resource waste.
Right-size workloads and nodes continuously
The rightsizing exercise during the production readiness review provides only short-term accuracy. Within weeks, new code, changing user traffic, and other service dependencies vary resource needs. As a result, previously optimized requests can quickly become inefficient or be throttled.
Rightsizing must be a continuous process. Maintaining efficiency depends on per-container monitoring and automated drift detection.
VPA limitations
Many teams use the native Vertical Pod Autoscaler (VPA), but its default settings have limitations.
The VPA recommender uses an eight-day data window, which misses longer-duration resource usage. You can extend this window, but it requires connecting the recommender to a long-term metrics backend, such as Thanos or Prometheus.
VPA is also incompatible with the native HPA when both target the same metric. HPA scales based on the percentage of requested resources, usually CPU utilization; VPA’s dynamic changes disrupt the baseline math, causing unstable scaling.
The latest version of VPA (autoscaling.k8s.io/v1) supports in-place updates, but dynamic memory changes are limited. If the node lacks available capacity or the container’s memory usage prevents safe updates, VPA evicts and recreates the pod.
Predictive rightsizing
To address these challenges, consider predictive rightsizing solutions such as Kubex Predictive Pod Scaler. It analyses long-term historical cycles to forecast resource needs and adjust pod requests before traffic spikes. It integrates with your existing scaling configurations to keep workloads stable.
| Scaling Strategy | Execution Mechanism | Impact |
|---|---|---|
| HPA only | Scales pod replicas out/in based on a primary trigger (e.g., CPU). | Duplicates static memory requests for every new pod. Can create compute waste during scale-out events. |
| HPA + Native VPA | VPA attempts to adjust requests while HPA changes replica counts. | Often creates conflicting scaling loops. In-place memory updates frequently fail, causing VPA to fall back to disruptive pod evictions under load. |
| HPA + Kubex | HPA manages replica count while Kubex predictively right-sizes pod requests. | Overall optimized footprint. Memory requests are dynamically tuned to match actual container usage without disrupting HPA’s baseline or triggering unpredictable evictions. |
It is important to accurately right-size resources that HPA does not actively scale, typically memory. When the target is set appropriately, HPA manages CPU efficiency but overlooks secondary resources. If a pod requests excessive memory, HPA will replicate this waste across all new replicas during CPU-driven scaling.
Finally, always rightsize workloads before sizing nodes. Configuring the cluster autoscaler or selecting node types based on inflated pod requests unnecessarily increases your compute footprint.
First, set correct pod requests, then let the node provisioner allocate infrastructure resources.
Spend less time optimizing Kubernetes Resources. Rely on AI-powered Kubex - an automated Kubernetes optimization platform
Free 30-day TrialUse spot capacity deliberately
Once pod requests and autoscaling triggers are aligned, you can use Spot or preemptible instances to reduce compute costs. This approach is not cluster-wide and requires workload-aware node placement. For example, stateless, burst-tolerant workloads that gracefully handle SIGTERM, such as batch processors, background jobs, or stateless APIs, are well-suited to preemptible instances.
When automating these capacity decisions, some solutions fully replace the native autoscaling tools with proprietary implementations. While this maximizes automation speed, it creates an environment that is difficult to troubleshoot during incidents.
In contrast, an advisory automation platform like Kubex calculates optimal pod requests and node configurations but lets native components (HPA, Karpenter) make the actual changes. This approach prioritizes easy reversibility.
Match provisioning patterns to your managed Kubernetes service
Using a single provisioning playbook across cloud platforms often causes resource misallocation. Managed node groups, reserved capacity, and autoscaler defaults differ among Kubernetes providers. A scaling strategy that works in one cloud can cause stranded capacity or throttling in another.
Node autoscaling typically uses two main engines: Cluster Autoscaler and Karpenter. Many cloud providers rebrand Cluster Autoscaler.
Cloud providers integrate Cluster Autoscaler with their own node-group mechanisms: GKE uses Managed Instance Groups, EKS uses managed node groups backed by EC2 Auto Scaling groups, and AKS uses Virtual Machine Scale Sets. GKE’s Node Auto-Provisioning extends Cluster Autoscaler to create and delete node pools, while AKS’s Node Auto-Provisioning is based on Karpenter.
The main change is the move from statically defined scale groups to Karpenter’s group-less, just-in-time provisioning. Here is a cross-cloud comparison of native node provisioning models.
| Environment | Native Provisioning Model | Architectural Impact |
|---|---|---|
| Google Cloud (GKE) | Proprietary Node Auto-Provisioning (NAP) | Dynamically creates node pools based on pod specs, reducing the need to pre-configure instance families. |
| AWS (EKS) | Managed Node Groups & Karpenter | Moving away from rigid Auto Scaling Groups toward Karpenter’s group-less, just-in-time node provision. |
| Azure (AKS) | VM Scale Sets (VMSS) & Karpenter (AKS NAP) | Relies on static VMSS, but actively shifting to Karpenter-powered NAP to mirror dynamic, workload-driven provisioning. |
Multi-cloud node provisioning
To address these cross-platform differences, many teams adopt Karpenter. Originally developed for AWS, Karpenter now serves as a multi-cloud node provisioner. Microsoft recently integrated Karpenter into AKS’s managed node auto-provisioning, allowing both EKS and AKS to bypass static node groups and provide just-in-time capacity.
Also, consider customizing rules for your environment. When migrating workloads, teams often carry over Cluster Autoscaler settings such as the scale-down-utilization-threshold, which defaults to 50%.
For example, migrating a memory-heavy application from GKE to a CPU-intensive EKS cluster without adjusting this threshold can leave a single DaemonSet and a few system pods keeping node utilization above the default threshold. As a result, the autoscaler will not terminate the node, leaving the instance active only for background logging agents.
To further control costs, your scaling strategy should determine which compute instances to provision. Solutions like Kubex Catalog Map compare existing AWS instances with alternative families and sizes, evaluating options such as m5.xlarge versus m7i.xlarge based on workload requirements and capacity.
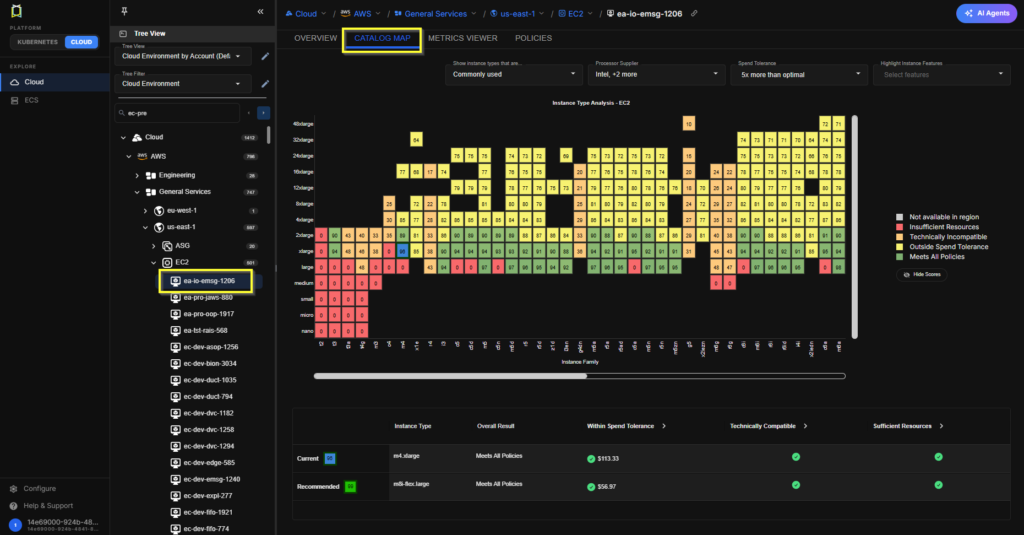
Accessing the Catalog Map (Source)
For advanced AI and ML workloads, comparing hourly compute rates alone is insufficient. Final provisioning decisions must balance minimum VRAM requirements, model inference latency, regional hardware availability, and pricing models.
Determining whether a job runs more efficiently on AWS g5 (Nvidia A10G) or GCP a2 (Nvidia A100) requires evaluating all relevant variables together. Tools like Kubex’s GPU Map match your specific model performance requirements against global cloud inventory, regardless of provider.
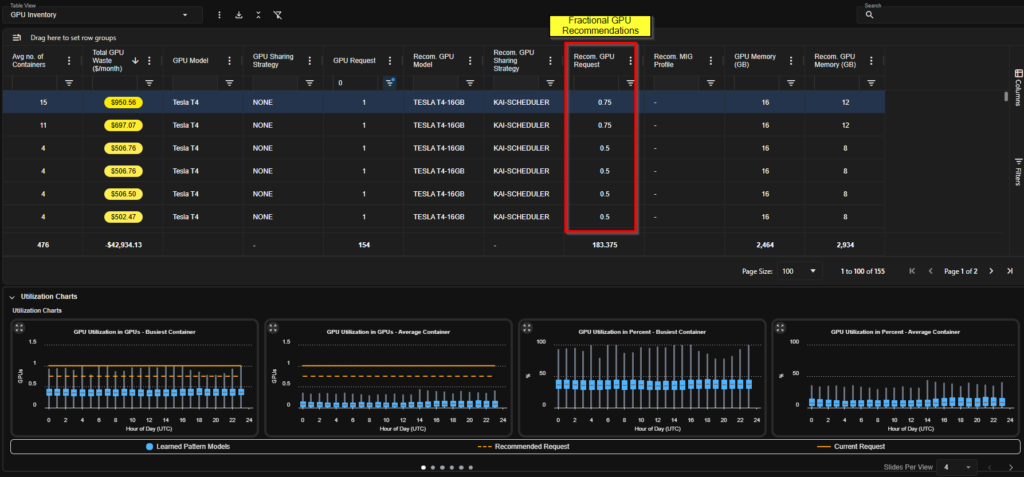
Kubex GPU Recommendations (Source)
Allocate spend by namespace and connect it to monitoring
In a multi-tenant Kubernetes environment, aggregate cluster billing is only actionable when costs are attributed to specific teams or services. Isolate workloads with namespace quotas and label-based allocation.
Establish labeling standards
To prevent misconfigured deployments from consuming shared cluster resources and increasing compute costs, start by assigning a ResourceQuota to every namespace.
apiVersion: v1
kind: ResourceQuota
metadata:
  name: compute-quota
  namespace: payment-services
spec:
  hard:
    requests.cpu: "10"
    requests.memory: 20Gi
    limits.cpu: "20"
    limits.memory: 40Gi
This configuration enforces resource boundaries for the payment-services namespace. Capping aggregate CPU and memory requests sets a hard limit on potential costs. When the namespace reaches this limit, the API server rejects new pod scheduling requests. At that point, you must right-size existing deployments or remove unused resources before deploying new services.
Integrate with visibility tooling
After establishing these boundaries and labeling standards (such as team: payments or cost-center: backend), you can integrate the cluster with visibility tools. OpenCost is the widely adopted open-source engine for visually displaying allocated spend. It integrates native Kubernetes metrics with cloud provider pricing or user-configured pricing to estimate infrastructure costs across clusters and resource types.
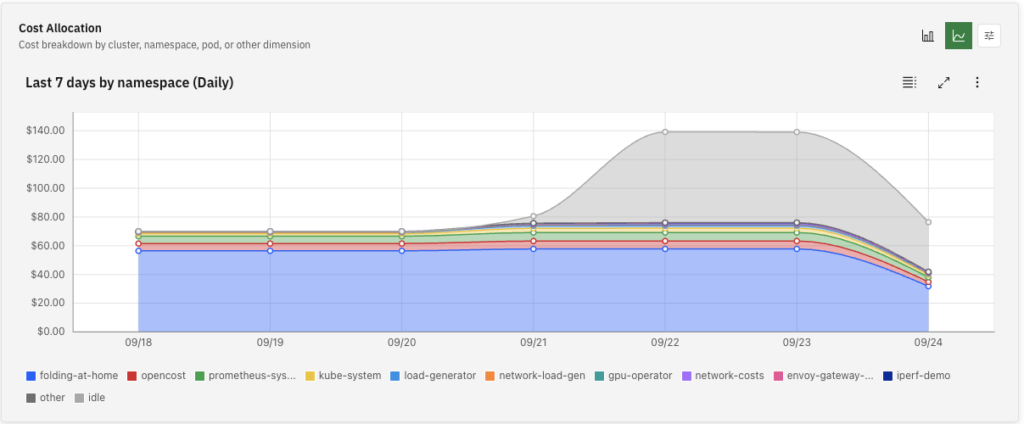
OpenCost’s Cost allocation by cluster, namespace, and workload (Source)
However, OpenCost’s analytical depth depends on your infrastructure. It processes Kubernetes-native data, but correlating these metrics with external multi-cloud PaaS costs, such as a managed RDS database, requires additional custom integration.
The key point is to recognize that visibility is not optimization. Allocation dashboards report namespace costs but do not address overprovisioned pod requests or inefficient node choices.
OpenCost provides cost reporting, but without automated solutions like Kubex offering predictive scaling and provisioning, visibility alone will not reduce your cloud bill.
Treat storage as its own optimization layer
Unlike compute resources, block storage costs increase linearly with provisioned capacity, regardless of actual usage. Key cost drivers include oversized PersistentVolumeClaims, inefficient StorageClass choices, and orphaned PersistentVolumes.
For example, deleting a StatefulSet or Helm release with a StorageClass set to reclaimPolicy: Retain leaves the underlying volumes active and fully billed, even though they are no longer attached to any workload.
Storage issues usually trigger alerts only when capacity is exhausted. If a container exceeds its ephemeral storage limit or fills its mounted volume, the kubelet evicts the pod.
Over-provisioning, however, generates no alerts. For instance, allocating a 500GB volume to a database that uses only 20GB results in 480GB of unused yet billed capacity. Because this doesn’t affect performance, such waste often goes unnoticed.
Conduct ongoing storage audits
Schedule recurring automated checks using Prometheus volume metrics, such as kubelet_volume_stats_used_bytes, to compare actual PVC utilization with the cost of the underlying StorageClass.
For example, you can use the following PromQL query to identify PVCs that are utilizing less than 20% of their provisioned capacity:
# Find PVCs using less than 20% of their allocated capacity
(kubelet_volume_stats_used_bytes / kubelet_volume_stats_capacity_bytes) < 0.2
Similarly, using kube-state-metrics, you can query for orphaned PersistentVolumes that are accumulating costs but are no longer attached to any active claims:
# Find PVs that are detached and accumulating idle costs
kube_persistentvolume_status_phase{phase=~"Released|Available"} == 1
Regular audits help identify underutilized volumes and orphaned disks, allowing you to migrate data to appropriately sized volumes or more cost-effective storage tiers.
Govern automation with policy guardrails and FinOps discipline
Deploying automated rightsizing and provisioning engines without strict policy guardrails risks cascading crashes and CPU throttling. If an automation platform uses a misconfigured threshold without approval gates, a single incorrect recommendation can cause a cluster-wide resource shortage, leaving critical services stuck in a Pending state.
Guardrails
To operate these systems safely at scale, enforce strict workload scoping by excluding sensitive namespaces, such as kube-system, and stateful databases from automated changes.
For example, excluding a critical database from a VPA or an external rightsizing engine typically requires a policy guardrail annotation like this:
apiVersion: apps/v1
kind: StatefulSet
metadata:
  name: core-payments-db
  namespace: production
  annotations:
    # Explicitly disable automated resource mutation for this stateful workload
    vpa.kubernetes.io/update-mode: "Off"
    finops.policy/auto-rightsize: "disabled"
spec:
  # ...
While these guardrails protect cluster stability, ongoing FinOps discipline is necessary to maintain optimization..
FinOps
A common issue in Kubernetes infrastructure is treating cost reduction as a one-time task. Without continuous processes, cluster density will decrease as new services are deployed
Implementing FinOps makes costs a shared responsibility, not just a platform team concern. This approach requires regular reviews, in which teams analyze namespace allocation dashboards and address baseline cost increases with the same urgency as application latency spikes.
To support this culture of shared responsibility, teams must trust the automation modifying their workloads. Whether you use a native autoscaler or a third-party rightsizing platform, automated actions cannot operate as a black box.
Instead of mutating resources in the background, the tooling must generate a verifiable audit trail of configuration changes, the metrics that triggered them, and the steps to reverse them immediately. This trail lets you revert the configuration to a previous commit or use audit logs to identify and undo a specific automated change.
When automation is verifiable, you can scale clusters while maintaining operational control.
Spend less time optimizing Kubernetes Resources. Rely on AI-powered Kubex - an automated Kubernetes optimization platform
Free 30-day TrialConclusion
Kubernetes cost optimization is an ongoing process, not a one-time task. Managing infrastructure spend at scale requires the same engineering rigor for resource efficiency as for application uptime.
Before making infrastructure changes, establish a baseline using historical metrics. Once you understand usage, dynamically right-size pod requests to avoid over-provisioning at the container level. Node provisioners should allocate compute resources only after these steps.
Allocation dashboards offer essential visibility but only report costs. Policy-driven automation is necessary to adjust resource requests safely. Enforcing strict workload boundaries and maintaining a verifiable audit trail for each automated action allows quick rollbacks.
If you are evaluating automation tools, Kubex uses this approach. It provides predictive pod rightsizing and intelligent instance mapping with full transparency. By generating a verifiable audit trail for every recommendation, you maintain complete control over execution.
Spend less time optimizing Kubernetes Resources. Rely on AI-powered Kubex - an automated Kubernetes optimization platform
Free 30-day Trial
Try us
Experience automated K8s, GPU & AI workload resource optimization in action.
Try us
Experience automated K8s, GPU & AI workload resource optimization in action.

 Guide

 Video