Real-Time Pod Rightsizing Software: 6 Features to Evaluate
Chapter 2Pod rightsizing in Kubernetes is harder than it looks. Static configurations drift out of alignment as traffic patterns shift, batch jobs can spike, and memory profiles evolve. The result is overprovisioned pods wasting node capacity and underprovisioned ones triggering OOM kills or CPU throttling. Real-time pod rightsizing software addresses this by continuously shortening the feedback loop between what workloads actually consume and how they’re configured.
Not all platforms approach this the same way. Reactive tools monitor live signals and adjust configurations as drift occurs. Predictive tools learn workload behavior over time and stage resource changes before pressure builds. The most capable platforms do both. The table below covers six features that define this category, organized by the mode they represent.
Summary of essential features of real-time pod rightsizing software
| Mode | Feature | Description |
|---|---|---|
| Reactive | Continuous monitoring with drift detection | Tracks per-container CPU and memory consumption across rolling time windows and flags configurations that have diverged from actual usage, distinguishing sustained drift from transient spikes before triggering adjustments |
| HPA and container spec co-optimization | Analyzes live throttling signals, OOM kill history, and saturation data to recommend HPA replica bounds and container resource specs together, preventing the race conditions that occur when horizontal and vertical scaling are tuned independently | |
| Predictive | Predictive pod scaling | Allows ML models to learn cyclical and seasonal workload patterns to generate resource scaling plans for peak and off-peak periods ahead of time, rather than adjusting only after throttling or OOM events occur |
| New container bootstrapping | Classifies new workloads by type to generate accurate resource specs from day one, then refines recommendations automatically as the platform accumulates container-specific behavior data | |
| Bin packing with placement awareness | Uses workload lifespan history to route long-running workloads away from short-lived nodes at scheduling time, preventing StatefulSet disruptions and scale-down blocking | |
| ML-driven node pre-warming | Identifies predictable workload start patterns to pre-scale nodes ahead of anticipated demand, eliminating provisioning delays before pods are scheduled |
-

Optimize workloads based on self-learning time-of-day patterns
-

Trust an automation controller w/ built-in workflow approvals & guardrails
-

Converse with an AI powered by specialized sub-agents & an MCP server


Continuous monitoring with drift detection
In many Kubernetes environments, the problem starts not at deploy time but weeks later. A container’s resource requests are set based on load testing or reasonable guesses, then nobody touches them again. Traffic grows, a new feature ships, or a dependency gets slower, and the configuration that was fine in month one is quietly wrong by month three.
The mechanism that prevents this is rolling window analysis. Instead of taking a point-in-time snapshot of usage, platforms built for continuous rightsizing track per-container CPU and memory consumption across configurable time windows and continuously compare them against the configured specs. When actual usage diverges from the spec, the platform flags it.
The gap becomes clear when you compare actual consumption with configured requests. In a cluster where specs haven’t been revisited since deployment, the divergence is often significant.
In the example below, the worker is consuming 480m of the 500m requested and approaching its CPU request. The api-server is using 12m of whatever was set at deploy time. Both containers have drifted, in opposite directions, and neither has been touched since launch.
$ kubectl top pods --containers -n production

POD                          NAME         CPU(cores)   MEMORY(bytes)
api-server-7d9f8b-xk2p9      api          12m          98Mi
api-server-7d9f8b-xk2p9      envoy        3m           21Mi
worker-6c4d9f-mn3q1          worker       480m         1.1Gi
worker-6c4d9f-mn3q1          filebeat     8m           44Mi
The trade-off with window length is worth understanding. Short windows react quickly but produce noisier recommendations, while long windows produce stable recommendations but miss medium-term behavioral shifts. A well-designed platform surfaces both signals and lets operators tune the sensitivity.
There is also a structural reason to track by container rather than pod. In multi-container pods, pod-level metrics aggregate consumption across every container running in that pod. If you have a main application container alongside a sidecar proxy such as Envoy or Linkerd, their resource usage is combined. Bottleneck analysis becomes guesswork. Per-container granularity surfaces which container is actually consuming what, and that distinction matters when writing recommendations.
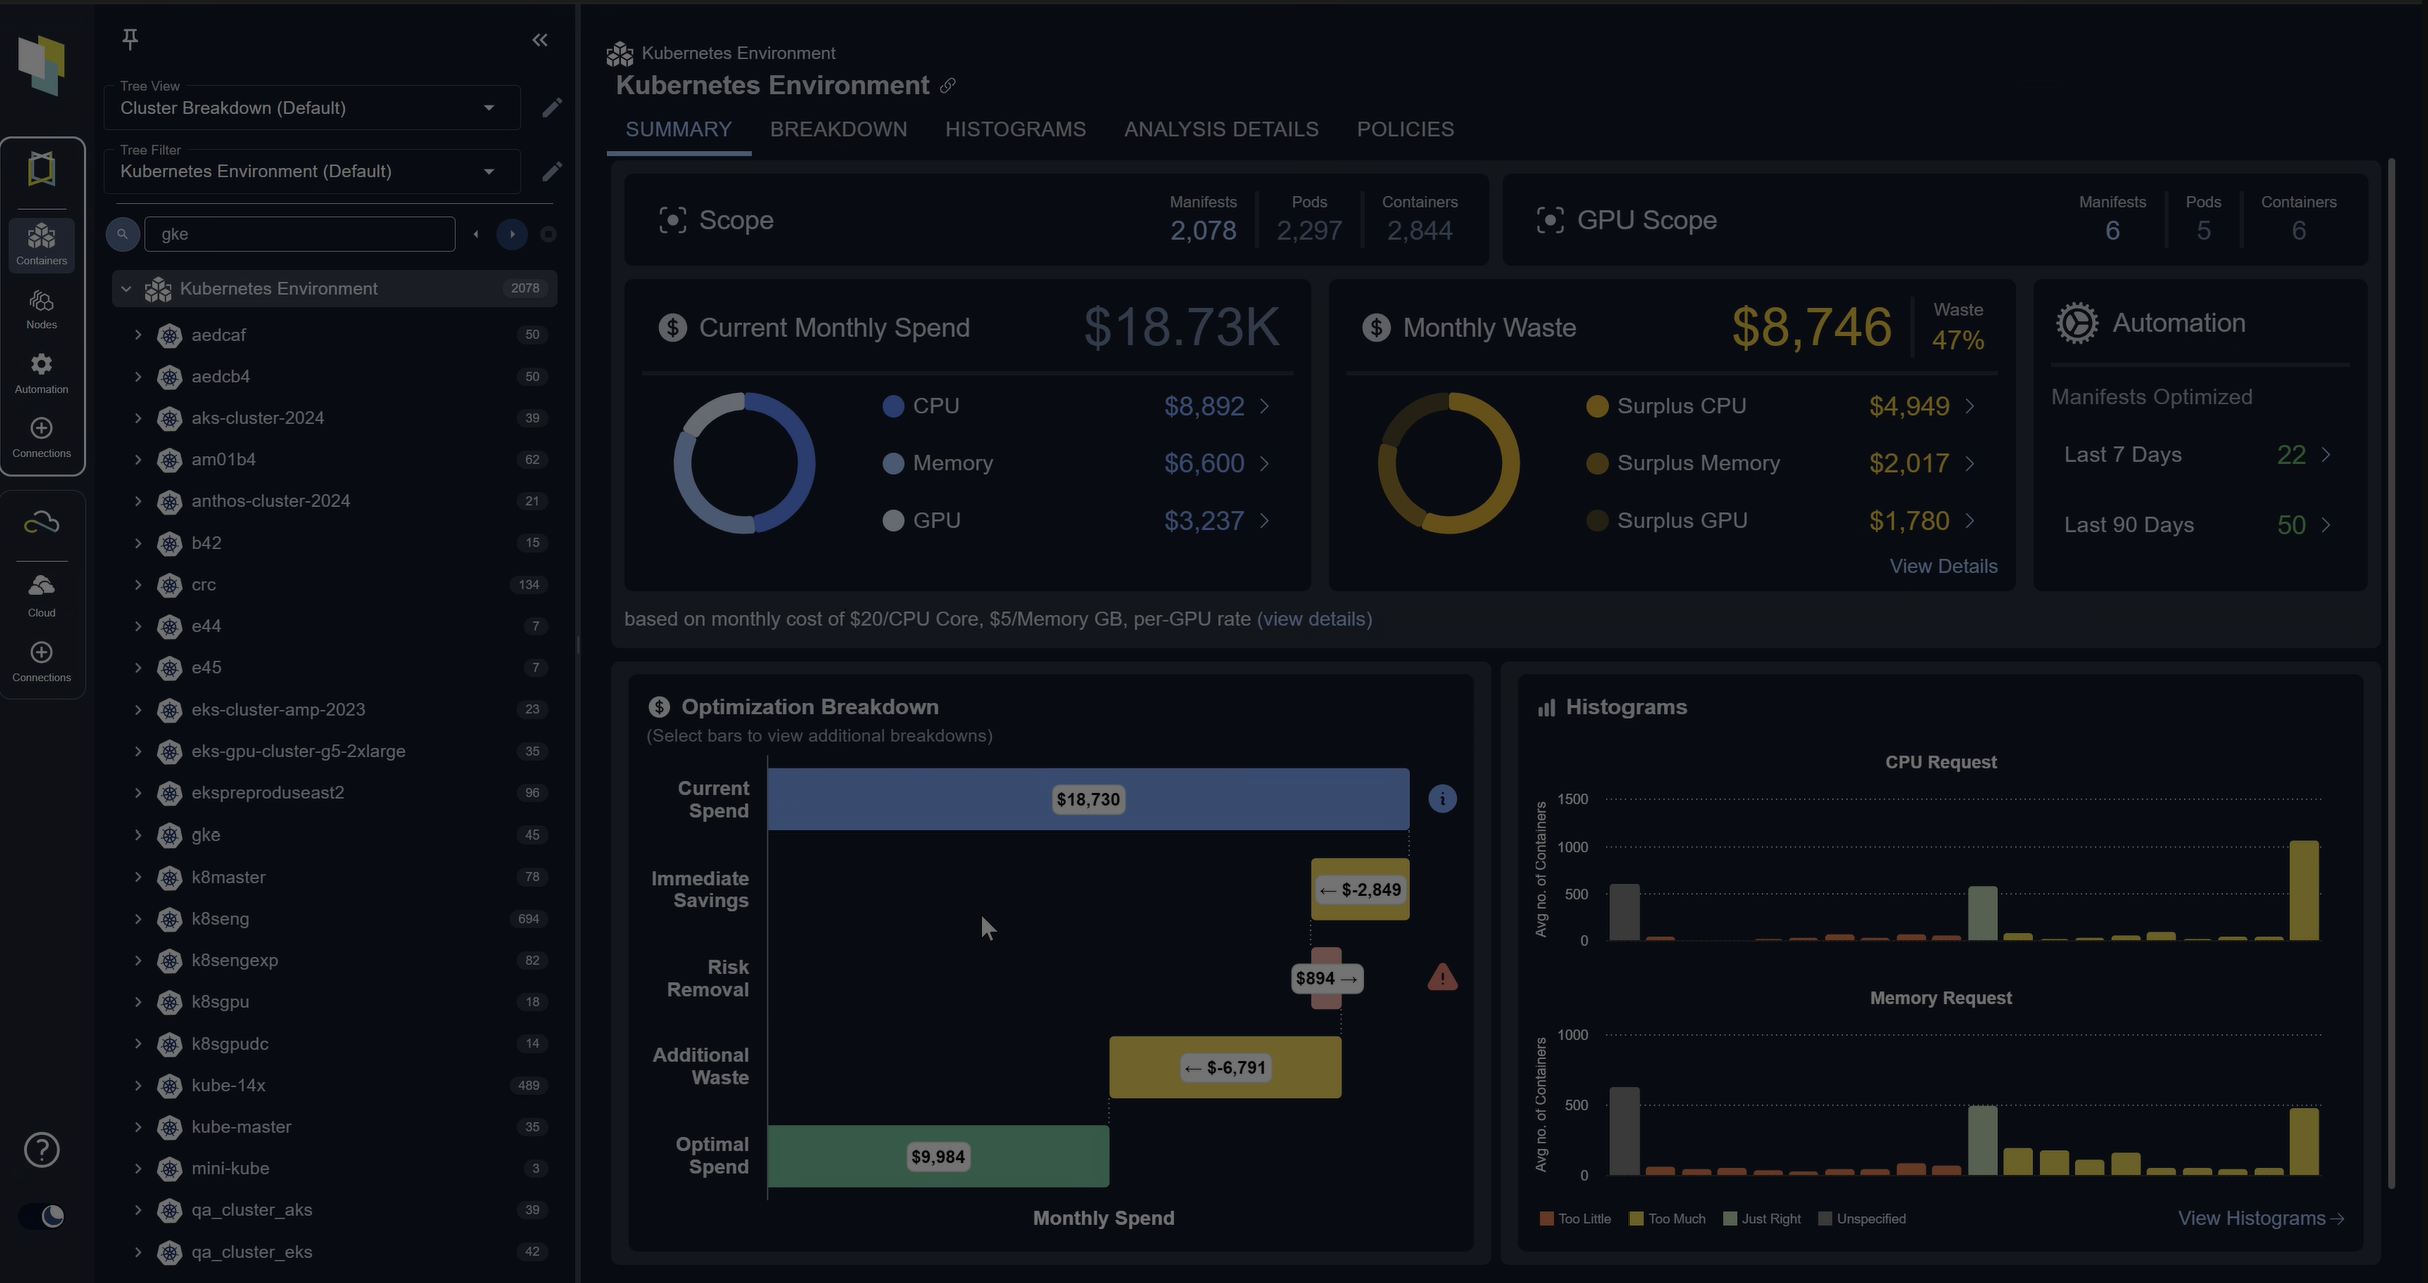
The screenshot below shows what this looks like at cluster scale: the gap between allocatable and requested CPU and memory, alongside an estimate of the wasted spend that drift produces.
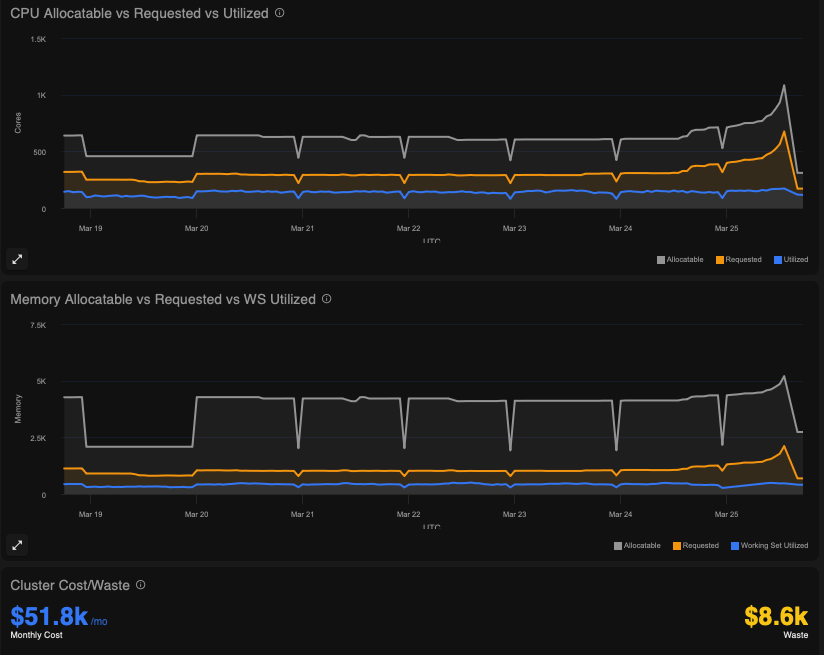
An example of the discrepancy between allocatable and requested CPU and memory in a typical Kubernetes environment, showing the estimated cluster cost and waste
The last piece is how the platform decides when to act. Constantly rewriting specs on every consumption fluctuation creates instability and alert noise. The right approach is threshold-based drift detection: small deviations from spec are monitored but not acted on, while sustained divergence beyond a meaningful threshold triggers re-evaluation. This filters transient spikes from genuine behavioral change.
HPA and container spec co-optimization
This is where most platforms get into trouble because HPA and VPA were not designed to coordinate with each other. VPA adjusts CPU and memory requests, but applying those changes requires restarting the pod. This applies when updateMode is set to “Auto”. HPA monitors CPU or memory utilization and adds or removes replicas based on thresholds. If VPA restarts a pod while HPA is actively scaling a deployment, you get a race condition: HPA is trying to maintain replica count while VPA is terminating pods to apply new specs. The result is unpredictable scaling behavior and elevated restart rates.
The configuration below shows how this conflict is set up: both controllers target the same deployment independently, with no shared state between them.
# HPA targeting the same deployment
apiVersion: autoscaling/v2
kind: HorizontalPodAutoscaler
metadata:
  name: api-server-hpa
spec:
  scaleTargetRef:
    apiVersion: apps/v1
    kind: Deployment
    name: api-server
  minReplicas: 2
  maxReplicas: 10
  metrics:
    - type: Resource
      resource:
        name: cpu
        target:
          type: Utilization
          averageUtilization: 60
---
# VPA targeting the same deployment
apiVersion: autoscaling.k8s.io/v1
kind: VerticalPodAutoscaler
metadata:
  name: api-server-vpa
spec:
  targetRef:
    apiVersion: apps/v1
    kind: Deployment
    name: api-server
  updatePolicy:
    updateMode: "Auto"
The solution is to analyze horizontal and vertical scaling together rather than in isolation. The HPA Optimizer looks at throttling signals, OOM kill history, and saturation patterns across containers to recommend both HPA replica bounds and container resource specs as a coordinated output. You get a single recommendation that accounts for both dimensions simultaneously.
CPU throttling happens inside the kernel’s CFS scheduler. A container that has hit its CPU limit keeps running but gets its execution time rationed. The pod looks healthy from Kubernetes’ perspective, but the application is degrading. Standard monitoring does not expose CFS throttling as a metric by default, so many teams do not realize how widespread it is in their clusters.
OOM kills are different. They are visible events, but by the time one occurs, the application has already crashed.
Both throttling and OOM kills indicate underprovisioning, but they require different remediation. Throttling points to a CPU limit that is too low, while OOM kills point to a memory limit that is too low.
Idle containers are the opposite problem. A container consuming 5% of its request spec is overallocated. Treating it as a separate category from underprovisioned containers is what lets the platform recommend downward spec changes that recover real node capacity without misclassifying well-behaved workloads.
Predictive pod scaling
Standard percentile-based tools are reactive by design, looking at recent consumption and recommend a spec based on some historical percentile, typically P95 or P99. This works reasonably well for flat workloads, but it falls apart for anything cyclical.
Suppose you have a workload that spikes every weekday morning, drops off midday, and nearly idles over the weekend. A reactive tool sees whatever happened recently and recommends based on that. If you run it on a Tuesday afternoon, you get a recommendation tuned for low utilization; if a spike then hits Wednesday morning, pods are already underspecified. The Predictive Pod Scaler takes a different approach by learning per-container behavior over days and weeks to identify recurring patterns, then generating scaling plans in advance rather than catching up after the fact.
In practice, this means the platform stages higher resource limits before a known peak and scales them back after. For a workday morning spike, the limit adjustment happens before users start sending requests, not after the first batch of throttling events arrives. Throttled containers degrade quietly, dropping requests or slowing responses before any alert fires.
Confidence and data recency matter here, too. A recommendation built on two days of data is less trustworthy than one built on three weeks’ worth. Platforms should surface this context explicitly so operators can make an informed decision about whether a recommendation is ready for production.
New container bootstrapping
The day a new container is deployed is the worst time to guess its resource configuration because there is no historical data, no usage baseline, and no signal to reason from. The typical result is that someone picks round numbers from memory or copies settings from a similar service. If the new service behaves differently under load, OOM kills arrive fast, and the fix is made under pressure with incomplete information.
The New Container Sizer addresses this by classifying new workloads by type at deployment time. The idea is that containers of the same category—a web API, a batch processor, or a queue worker—tend to exhibit similar resource consumption patterns even before any container-specific data exists. Applying a template derived from observed behavior across that workload class gives you a grounded starting point rather than a guess.
The difference between a guessed spec and a class-derived one is visible in the numbers. Here’s what that looks like for a queue worker, first as it typically arrives, then after workload classification.
resources:
  requests:
    cpu: "500m"
    memory: "512Mi"
  limits:
    cpu: "1000m"
    memory: "1Gi"
The initial spec overallocates CPU by roughly 4× and memory by nearly 3×. That headroom feels safe at deployment time, but across a large cluster with dozens of new services, it compounds quickly into wasted node capacity. The class-derived spec starts closer to actual behavior and tightens further as the platform accumulates container-specific data.
Here is what the class-based recommendation generates for that same queue worker:
# After: spec generated from workload class behavior
resources:
  requests:
    cpu: "120m"
    memory: "180Mi"
  limits:
    cpu: "300m"
    memory: "320Mi"
This is not a static assignment. As the platform accumulates actual container-specific data, the initial class-based recommendation gets refined automatically. The transition happens without manual intervention. Operators do not need to remember to revisit the configuration after a few weeks; the platform updates it as the picture becomes clearer.
The practical implication is significant: eliminating the OOM-kill-and-fix cycle for new deployments. That cycle is expensive not because of the time it takes to update a YAML file but because it usually happens at the wrong time: during an incident or at a deadline, when the quality of the fix will be low.
Bin packing with placement awareness
Imagine you have a StatefulSet running a distributed database, and its pods are scheduled across a mix of on-demand and spot nodes. Then a spot node gets preempted. The StatefulSet pod on it needs to be rescheduled, and during that window, the database will run with reduced capacity. This is a common failure pattern in clusters that mix node lifecycle types without placement awareness.
The underlying issue is that Kubernetes’ default scheduler does not account for the lifespan of workloads when making placement decisions. It packs pods to make efficient use of current node capacity, but it does not consider whether a long-running workload landing on a short-lived node is a bad idea.
The Bin Packer applies predictive placement logic at scheduling time to route long-running workloads away from short-lived nodes. The classification is based on restart frequency, uptime history, and workload type. A StatefulSet with rare restarts and long average uptime is classified as long-running and steered toward stable node types.
The diagram below illustrates how the bin packer applies this classification, routing a StatefulSet’s pods to stable on-demand nodes while keeping short-lived workloads on spot capacity.
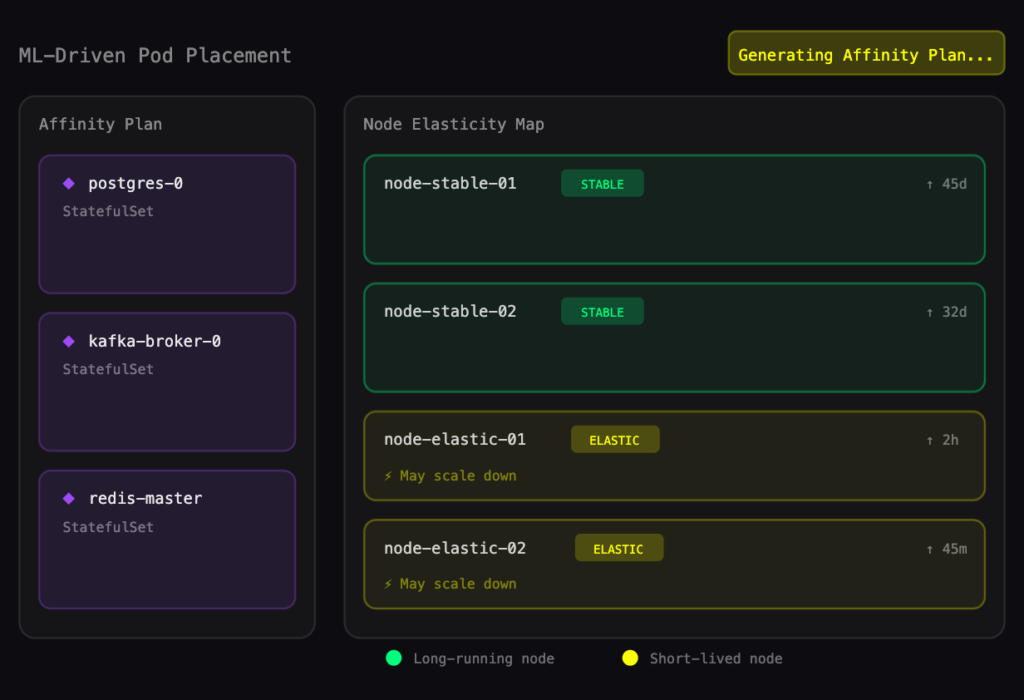
An illustration of the bin-packing automation process optimizing three StatefulSet affinity plans against the existing node in the cluster
The subtler problem is scale-down blocking. Even if the placement policy is configured correctly, workloads can drift onto the wrong node type over time through rescheduling events. When that happens, the cluster cannot scale down the node because a long-running workload is still on it. The visibility layer matters here: Surfacing which specific workloads are holding which nodes gives operators the information they need to act, either by relocating the workload or adjusting the placement policy.
ML-driven node pre-warming
Reactive node scaling always carries a provisioning delay. The sequence looks like this: A pod gets scheduled, no node has capacity, the cluster autoscaler requests a new node, the node boots, it passes readiness checks, and finally the pod starts. Depending on the cloud provider and node configuration, that sequence can take anywhere from 2 to 5 minutes. For batch jobs that run on a schedule or for AI inference workloads expected to start immediately, that delay is a hard failure.
The mechanism behind the Node Pre-Warmer is pattern recognition over workload start events. If a set of pods consistently starts at 8 am on weekdays, the platform identifies that pattern and pre-scales the required nodes ahead of time. At 8 am, the nodes are already running and ready. Pods schedule immediately.
The visualization below shows how the pre-warmer maps historical pod start patterns to node capacity, scaling ahead of demand rather than in response to it.
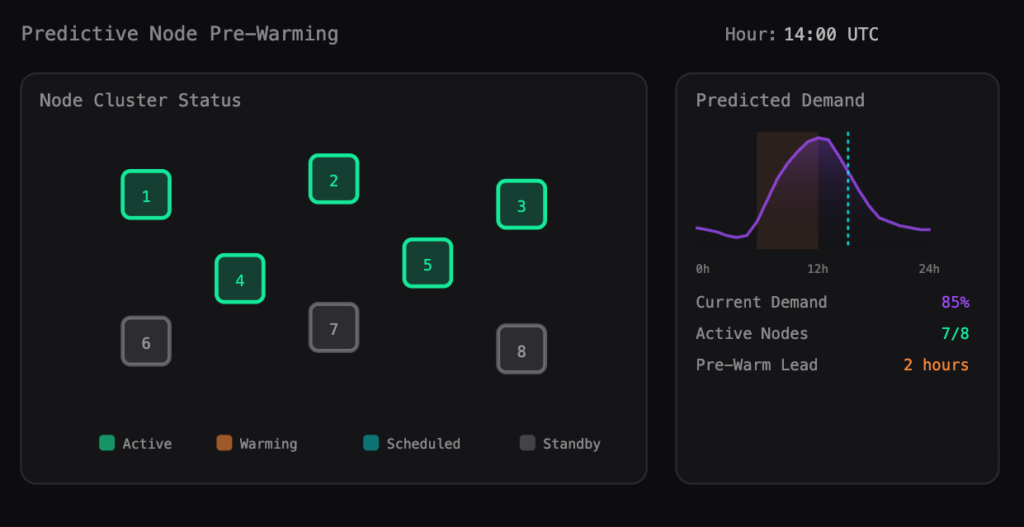
Visualization of how predictive node pre-warming would look in practice against existing nodes and historically calculated predictive demand
This is particularly relevant for GPU workloads. GPU nodes take longer to provision than CPU nodes, and driver initialization adds time on top of that. Depending on the cloud provider, node type, and driver configuration, a GPU node provisioned on demand can take anywhere from 2 to 10 minutes to accept workloads. Pre-warming integrates with Karpenter-based node autoscaling to apply predictive scaling decisions through the same node provisioning path that already manages cluster capacity.
The underlying principle is the same across all six features covered here: acting on predicted behavior is consistently cheaper than reacting to observed failures. Throttling, OOM kills, scheduling delays, and placement-driven scale-down blocks all have one thing in common. By the time they surface, something has already gone wrong. The platforms worth evaluating are those that perform the analytical work to stay ahead of those events.
Conclusion
The features above are not all equally common. Per-container monitoring and drift detection are table stakes at this point. Predictive scaling, HPA co-optimization, and intelligent bootstrapping are where meaningful platform differentiation starts to appear.
A few practical questions to drive evaluation:
- Does the platform track CPU throttling, or only resource utilization? Most monitoring tools do not expose CFS throttling. Most monitoring tools do not expose CFS throttling. Platforms that track it have a more accurate picture of container performance and can surface degradation that utilization metrics alone won’t catch.
- How does the platform handle HPA and VPA interaction? If the answer is that they manage them separately, you will likely see the race condition described earlier in production.
- What does the platform recommend for a container with no historical data? If the answer is a fixed template or nothing at all, the bootstrapping problem is still yours to solve.
- How does the platform surface placement issues? Recommendations are useful; visibility into what is blocking scale-down is more useful.
No platform eliminates operational complexity entirely, but the right one shifts the work from reactive firefighting to reviewing recommendations and adjusting policy, which is a substantially better use of SRE time.
Try us
Experience automated K8s, GPU & AI workload resource optimization in action.
Try us
Experience automated K8s, GPU & AI workload resource optimization in action.