Pod Rightsizing Platforms: The Must-Have Features
Chapter 1Pod rightsizing is straightforward when you have a single cluster and a single team: You look at utilization data, adjust requests and limits, and move on. The problem arises when the environment grows, such as having a second cluster, a second cloud provider, or a second team with stricter SLA requirements. Suddenly, the coordination overhead exceeds the optimization work itself. Recommendations pile up with no clear path to production, and automated changes bypass version control. Each cluster is tuned independently, and there’s no consistent view across them. At that point, you’re not dealing with a tooling problem anymore; you’re dealing with a platform problem.
This article covers the six features that determine whether a pod rightsizing platform can hold up at organizational scale: multi-cluster visibility, policy controls, automation depth, workflow integration, observability stack compatibility, and recommendation transparency.
Summary of essential pod rightsizing platform features
| Feature | What it does |
|---|---|
| Multi-cluster and multi-cloud visibility | Aggregates rightsizing analysis across clusters, cloud providers, and hybrid environments, so teams have a consistent view regardless of the number of environments they manage. |
| Policy and guardrail controls | Lets operators define which namespaces, workloads, and resource bounds are covered by automation, keeping rightsizing away from workloads where automated changes aren’t appropriate. |
| Automation levels and change delivery | Covers the full range from recommendation-only to automated delivery via mutating admission controller or GitOps, with approval gates that separate behavior across environments. |
| Workflow and ticketing integration | Connects recommendations to JIRA and ServiceNow so engineers can act on them without leaving their existing workflows, which is what actually drives adoption. |
| Observability stack integration | Ingests from Prometheus as the core data source and surfaces optimization data back into Grafana rather than requiring a separate dashboard to check. |
| Recommendation justification and audit trails | Surface the consumption data, time window, and workload behavior behind each recommendation so operators can act on them in production without first verifying them. |
-

Optimize workloads based on self-learning time-of-day patterns
-

Trust an automation controller w/ built-in workflow approvals & guardrails
-

Converse with an AI powered by specialized sub-agents & an MCP server


Multi-cluster and multi-cloud visibility
In many Kubernetes environments, the problem with rightsizing starts at the data boundary. Each cluster has its own metrics, recommendations, and view of which resources are doing what. When teams are running workloads across EKS, GKE, and AKS simultaneously, those per-cluster views don’t add up to anything useful. You can’t compare resource utilization across environments, identify the biggest waste, or prioritize actions.
Cross-cluster aggregation solves this by pulling analysis into a single view across providers and clusters. The value isn’t just convenience. When you’re managing dozens of clusters, a unified view is what makes it possible to act on recommendations. Platforms like Kubex support AWS, Azure, and GCP, as well as EKS, AKS, and GKE, providing teams with a consistent optimization model regardless of which cloud they run on.
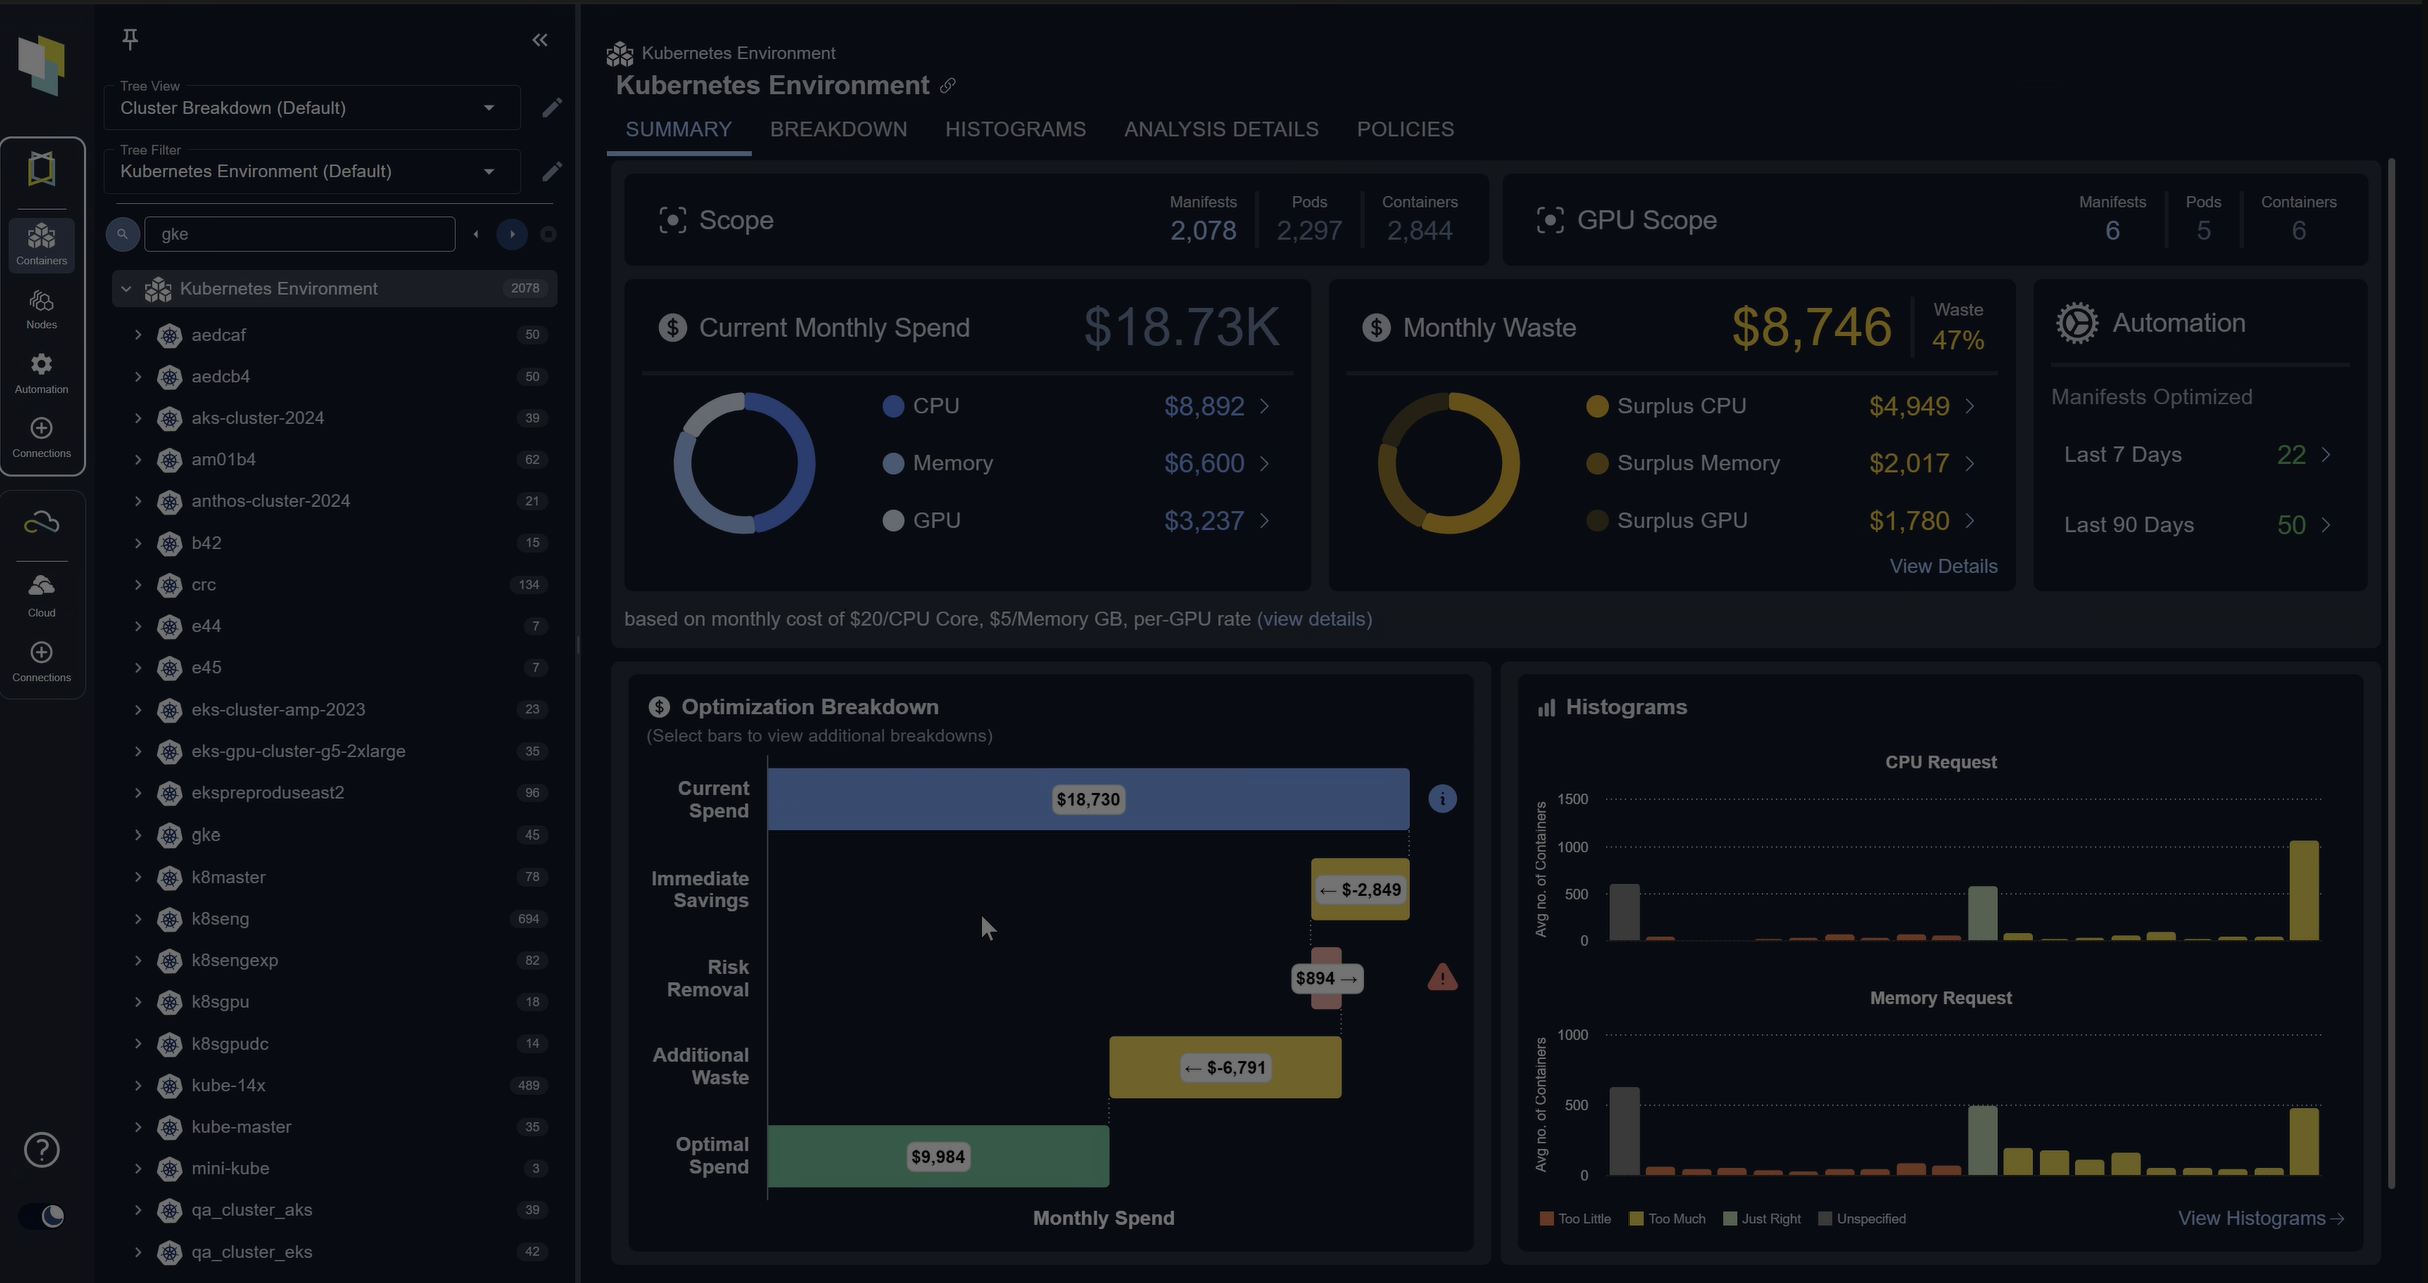
The screenshot below shows how Kubex aggregates workload rightsizing data across multiple clusters in a single view. Each row maps to a specific workload, with current resource requests, actual utilization, and recommended values displayed side by side across all connected environments.
Kubex cross-cluster rightsizing overview — workload resource requests and recommendations unified across AWS, Azure, and GCP clusters
Namespace and workload attribution matter here, too. As cluster count grows, you need to map resource consumption and recommendations back to specific teams, namespaces, or business units. Without that mapping, visibility at scale is still just noise. With it, you can have real conversations about which teams are overprovisioning and where the highest-impact changes are.
The same logic applies to hybrid and on-premises environments. Teams running Red Hat OpenShift or distributions like RKE and NKP alongside the public cloud need the platform to apply the same analysis model across all environments. Running one tool for cloud and another for on-prem means you’re always making decisions with incomplete data.
Policy and guardrail controls
Not every workload should be touched automatically. This is the part that gets underestimated early in a rightsizing rollout and overestimated in complexity once the platform is set up.
The key idea here is that automation without scope controls creates risk. Stateful databases, licensed software, and latency-sensitive workloads often have resource requirements that don’t fit the standard application container model. Applying blanket rightsizing across all workloads treats them the same, which they aren’t.
Namespace-level resource bounds let operators set CPU and memory ranges by namespace or workload class. Different namespaces have different SLA commitments. For example, a namespace running batch jobs has a different tolerance for resource changes than one running a payment processing service. Policy controls make that distinction explicit rather than leaving it to manual exception handling.
Policies and guardrails turn rightsizing from a global rule into something you can scope. Namespace quotas and limit ranges are a common Kubernetes pattern: They cap what a team can request in aggregate and set sane defaults so automated or manual changes stay inside agreed bounds.
The following example defines a ResourceQuota and a LimitRange for a payments namespace. The ResourceQuota caps aggregate CPU and memory for everything running in the namespace. The LimitRange sets per-container defaults and hard maximums so individual pods stay within declared bounds.
# Example: namespace-scoped CPU/memory bounds
apiVersion: v1
kind: ResourceQuota
metadata:
  name: team-payments-quota
  namespace: payments
spec:
  hard:
    requests.cpu: "200"
    requests.memory: 400Gi
    limits.cpu: "400"
    limits.memory: 800Gi
---
apiVersion: v1
kind: LimitRange
metadata:
  name: team-payments-limits
  namespace: payments
spec:
  limits:
    - type: Container
      defaultRequest:
        cpu: 100m
        memory: 128Mi
      default:
        cpu: 500m
        memory: 512Mi
      max:
        cpu: "4"
        memory: 8Gi
With these two objects in place, automated rightsizing changes targeting this namespace cannot exceed the declared bounds. Any change that falls outside them is rejected at admission time, which gives platform teams a lever that is easier to audit than ad hoc edits to individual deployments.
Approval workflows separate automation behavior across environments. Recommendations in dev and staging can apply automatically, while the same platform requires a human approval gate before any change reaches production. This preserves the efficiency gains of automation in lower-risk environments without bypassing review where it matters.
Automation depth and change delivery
The range of automation depth looks like this in practice. At one end, recommendations surface in a UI, and someone has to manually translate them into a change. At the other end, the platform applies changes automatically the moment a pod is admitted. Most production environments need something in between, and where a team lands on that spectrum determines how much value they actually get.
The diagram below shows an example of such configurations in Kubex. In this case, we can see that automation is enabled for 5 clusters and the number of invocations over the last 24h.
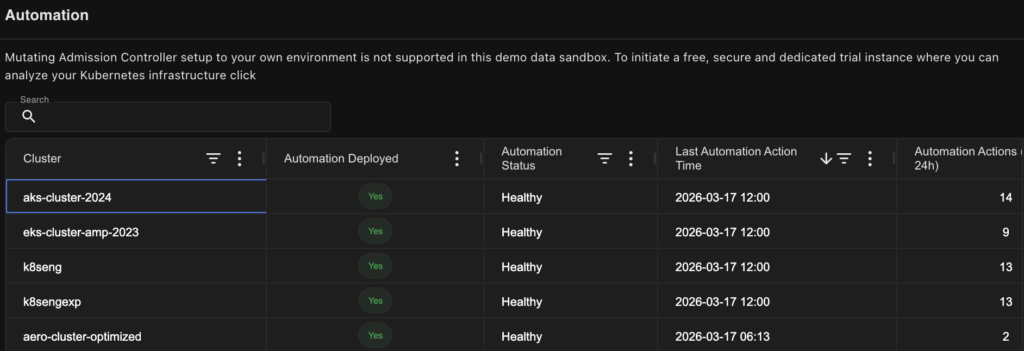
An example of the rightsizing automation configuration window in Kubex AI, including the statistic of invocations for the last 24 hours
The two primary delivery mechanisms of pod rightsizing mechanics are mutating admission controllers and GitOps integration. These solve different problems.
Admission controllers intercept objects at pod creation time and serve multiple roles in Kubernetes: enforcing security policies, injecting sidecars, and setting resource defaults. In the rightsizing context, a mutating admission controller adjusts resource specs before the pod is scheduled. Changes are immediate and don’t require a separate deployment cycle. The downside is that these changes don’t appear in version control unless the platform also writes them back to source. That’s the GitOps problem. Platforms that centralize admission controller configuration give teams a single place to define and audit these policies rather than maintaining them separately per cluster.
When automated changes bypass version control, drift detection breaks. If something goes wrong, teams must look in multiple locations to determine what changed and when. Platforms that commit changes through a GitOps workflow close that gap. Every adjustment is traceable and reversible, which matters for both rollbacks and audits.
IaC and CI/CD integration covers the path from recommendation to deployed change for teams that manage resources in Terraform or Helm. The manual step of translating a recommendation into an infrastructure update is where drift typically starts. Platforms that integrate with Terraform, Helm, and CI/CD pipelines automate that translation, rather than leaving it as a human task that is inconsistently performed.
Workflow and ticketing integration
The pattern that repeats with any new DevOps tooling is straightforward: If acting on a tool’s output requires engineers to leave their existing workflow, adoption stalls. It doesn’t matter how good the recommendations are—if there’s context-switching involved, throughput drops.
Most rightsizing recommendations go unactioned not because engineers disagree with them but because acting on them means opening a separate console, finding the right workload, understanding the recommendation, and then manually creating a ticket to track the change. Platforms that connect to JIRA and ServiceNow eliminate that path. The ticket gets created automatically, it includes the recommendation details, and the engineer can act on it from the workflow they’re already in.
There’s another dimension to this that doesn’t get discussed enough: recommendation staleness. There’s a gap between when a recommendation is generated and when a ticket gets resolved. Workload behavior doesn’t pause during that window. A recommendation generated on Monday might be stale by Thursday if the workload’s usage pattern shifts. Platforms need a mechanism to track freshness and invalidate or update tickets when the underlying data changes. Otherwise, engineers are acting on outdated guidance and wondering why results don’t match expectations.
Freshness tracking works by continuously re-evaluating the underlying utilization data against open tickets. When a workload’s behavior exceeds a defined threshold after a ticket is created, the platform has two options: update the existing ticket with the revised values and flag it as refreshed, or close it and open a new one with the current data. Either way, the engineer sees a clear signal that the recommendation has changed since they last looked at it. Without this mechanism, the ticket queue becomes a liability. Engineers learn to distrust it, and adoption regresses to the same manual verification loop the integration was supposed to replace.
Observability stack integration
Infrastructure metrics alone don’t tell you whether a resource reduction will affect latency or error rates. That’s the core problem with rightsizing in isolation: You can see that a container is using 200m CPU when it’s requesting 2000m, but you can’t know whether that 200m figure includes traffic spikes, batch jobs, or garbage collector pauses without looking at application-level signals alongside it.
Prometheus is the core data source for rightsizing. Platforms that treat it as the primary input to their optimization model, rather than one signal among many, produce more consistent and auditable recommendations. Platforms like Kubex also rely on the Kubernetes metrics API alongside Prometheus for a more complete behavioral picture. External sources from Datadog, New Relic, and OpenTelemetry can augment specific signals, but the core recommendation logic needs a stable primary data source to stay reproducible.
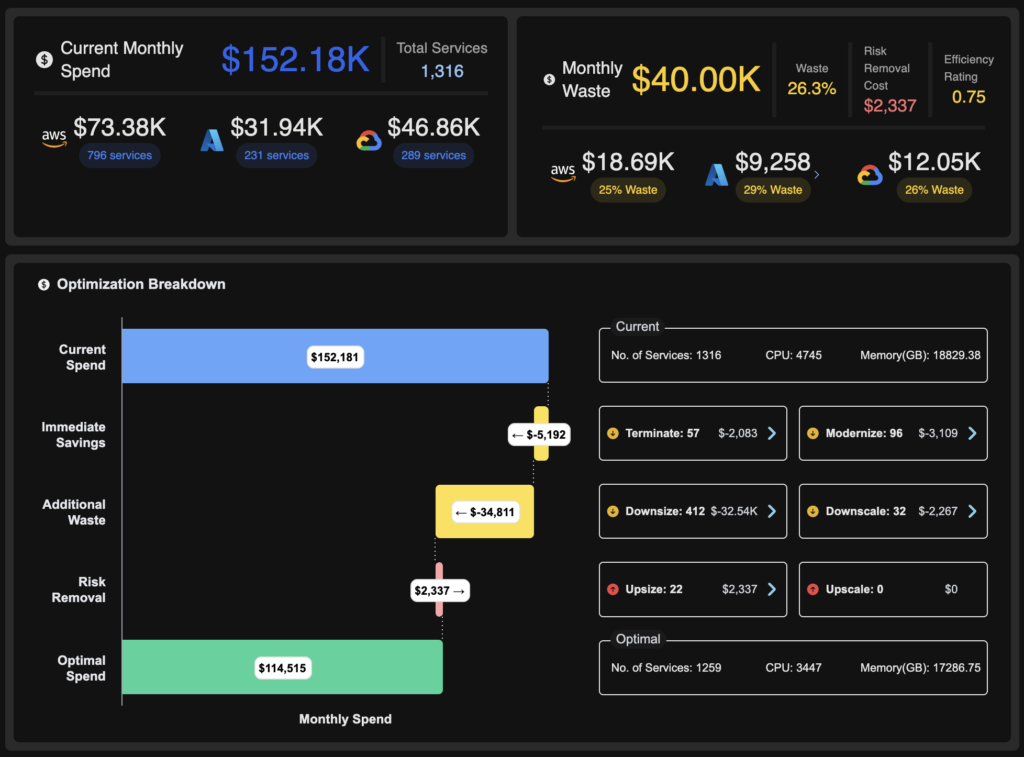
The screenshot below shows Kubex pulling utilization data from Prometheus and surfacing rightsizing recommendations alongside the raw consumption metrics. The view lets operators see the recommendation, the data behind it, and the gap between current requests and actual usage in a single panel.
Kubex rightsizing recommendations surfaced alongside Prometheus utilization data: CPU and memory usage vs. declared requests
Beyond ingesting metrics for analysis, platforms also need to surface optimization data where engineers already work. Kubex, for example, can be integrated with existing Grafana dashboards, embedding rightsizing recommendations directly into the dashboards teams already use for operational review. This addresses the visibility problem: Rightsizing data that requires a separate console is checked less often, and when it is checked, the context switch breaks its connection to the operational workflow.
The broader principle is non-replacement integration. Teams depend on the observability stacks they already have. Asking them to deprecate those tools as a precondition for rightsizing creates resistance to adoption before you’ve even started. Platforms that augment the existing stack reduce both deployment risk and the organizational negotiation required to get started.
Recommendation justification and audit trails
A recommended value on its own isn’t enough to act on in production. The questions that operators always ask are:
- What’s this based on?
- How much history does this represent?
- What would invalidate it?
The answer matters because two recommendations with identical suggested values can carry very different levels of confidence. A recommendation backed by 30 days of stable workload behavior is not the same as one backed by 72 hours of post-deployment data. Platforms that surface consumption patterns, time windows, and workload behavior alongside the recommendation give operators what they need to make that judgment rather than requiring them to go find it manually.
Tools like the Kubex AI Agent provide a conversational interface for exploring that data. Instead of digging through dashboards to understand why a specific container received a specific recommendation, you can query it directly. That represents a meaningful difference in operational speed when you’re working through a large queue of recommendations.
The screenshot below shows the Kubex AI Agent interface. An operator has queried the reasoning behind a specific container’s recommendation, and the response includes the time window analyzed, the workload’s consumption pattern, and the methodology used to produce the suggested values.
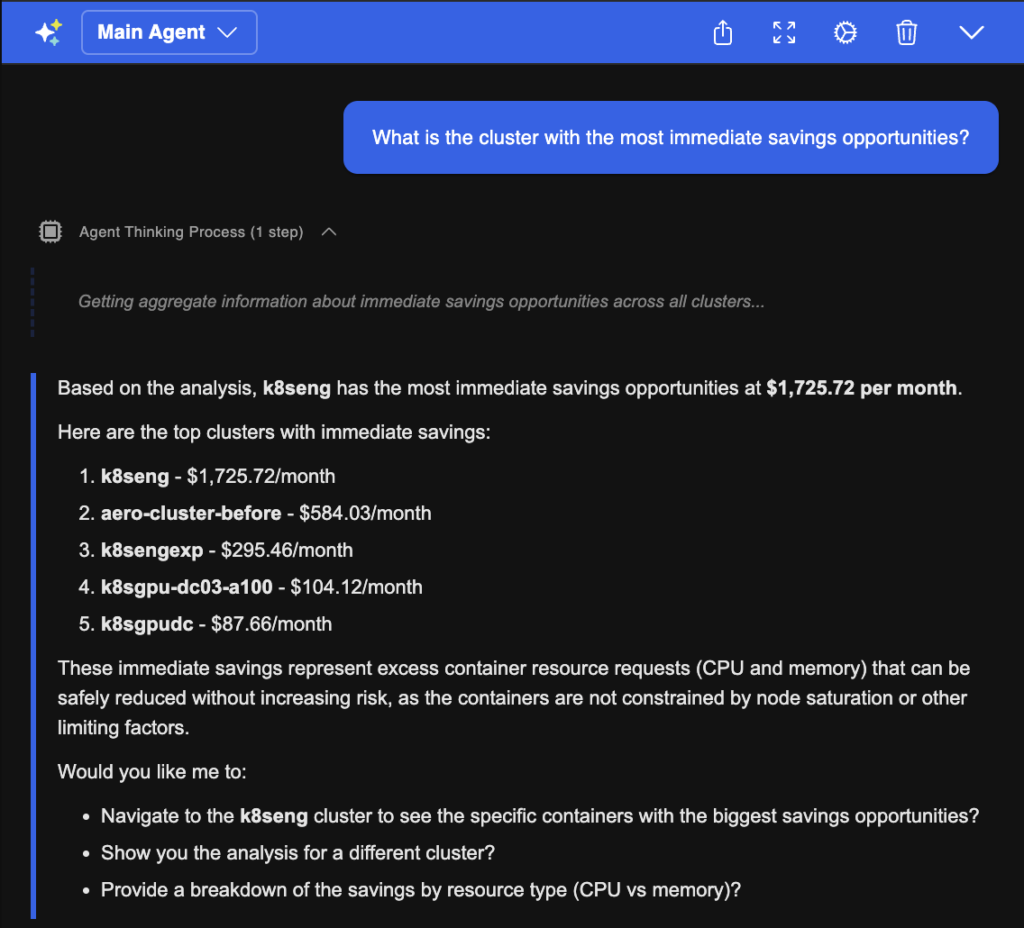
An example of the Kubex AI Agent returning recommendation context: consumption data, analysis window, and justification for a specific container
The audit trail question is different in kind. It matters when something goes wrong. If a resource adjustment contributes to an incident, the postmortem needs to know what changed, when, why the platform recommended it, and who approved it. That log also matters for compliance reviews. A platform that links each change to its recommendation, supporting data, and approval chain gives you that record without requiring teams to reconstruct it manually after the fact.
One design principle worth noting: the strongest recommendation engines prioritize workload stability over savings. A recommendation that recovers 500m of CPU at the cost of a performance regression during peak isn’t a good recommendation. The underlying analytics need to account for that, and the platform should be transparent enough about its methodology that operators can trust it to have done so.
Conclusion
Getting value from pod rightsizing at scale isn’t just about generating accurate recommendations. It requires the infrastructure to support those recommendations: scope controls, change delivery mechanisms, workflow connections, observability integration, and transparency to act on them with confidence rather than faith.
The six features covered here address the gaps that appear when a single-cluster, single-team setup grows into something more complex. Multi-cluster visibility gives you a unified view. Policy controls give you the scope boundaries. Automation depth covers the path from recommendation to deployed change. Workflow integration determines whether recommendations actually get acted on. Observability integration grounds recommendations in real workload behavior. And the recommendation justification gives operators the data they need to act without first verifying it themselves.
Each of these features works independently. Together, they determine whether a rightsizing platform holds up under complex environments.
Try us
Experience automated K8s, GPU & AI workload resource optimization in action.
Try us
Experience automated K8s, GPU & AI workload resource optimization in action.
Explore other resources
-
 Analytst Reports
Kubex is positioned as a Leader and Fast Mover in the Cloud Resource Optimization Radar
-
Analytst Reports
Kubex is positioned as a Leader and Outperformer in the Kubernetes Resource Management Radar
-
 Guide
Guide
Real-Time Pod Rightsizing Software: 6 Features to Evaluate