Kubernetes Requests vs Limits: Best Practices & Examples
Chapter 2One of the most critical skills to learn and practice when optimizing your Kubernetes environments is understanding Kubernetes requests vs limits and how to set them appropriately. If you find a Pod being heavily CPU throttled or repeatedly killed by the OOMKiller, you have most likely set its resource requests and limits incorrectly.
A common misconception about Kubernetes is that you can just deploy containers, and it will automagically balance all their competing needs and demands at the optimal level. Another is that Kubernetes manages the resources required to run the containers itself. In fact, Kubernetes makes informed decisions about where to place workloads and guides the kernel running the nodes on how best to manage them, all based on the requests and limits set for each container.
Although Kubernetes manages many resources, we will focus here on the most critical: CPU and memory, known collectively as compute resources. We will explain how Kubernetes allocates and manages these resources, and how to inform the mechanism to provide the most stable and optimal production environment. Specifically, we will show you how to set Kubernetes requests vs. limits in your environments and strategies for optimizing them.
Spend less time optimizing Kubernetes Resources. Rely on AI-powered Kubex - an automated Kubernetes optimization platform
Free 30-day TrialUnderstanding Kubernetes Requests and Limits Fundamentals
By default, containers run with unbounded compute resources on a Kubernetes cluster. You may impose boundaries by setting requests and limits to specify how much of a resource a container needs to execute and the maximum amount it is allowed to consume.
What Are Kubernetes Resource Requests?
Kubernetes Resource Requests set the minimum resources a container requires to operate. Kubernetes guarantees that the container will be allocated the requested resources when it starts running on its assigned node. In other words, if a container requests 512 MiB of memory, it will be guaranteed at least 512 MiB of RAM when it starts running.
Here is an example of setting resource requests for a Pod with one container:
apiVersion: v1

kind: Pod

metadata:

  name: app-with-requests-only

spec:

  containers:

    - name: demo-app

      image: nginx:1.27

      ports:

        - containerPort: 80

      resources:

        requests:

          cpu: "250m"        # Requests 0.25 CPU core

          memory: "256Mi"    # Requests 256 MB of RAM
What Are Kubernetes Resource Limits?
Kubernetes Resource Limits set the maximum amount of CPU or memory a container should consume when running. These limits do not prevent the container from attempting to use more than the set value, but they help you manage the overall resources in the cluster. In other words, if a container sets a memory limit of 512 MiB, it will be allowed to use up to 512 MiB of RAM while it is running. It is important to note that exceeding a container’s limits has consequences, which will be examined below.
Here is the same example as before, but now with limits set:
apiVersion: v1

kind: Pod

metadata:

  name: app-with-requests-and-limits

spec:

  containers:

    - name: demo-app

      image: nginx:1.27

      ports:

        - containerPort: 80

      resources:

        requests:

          cpu: "250m"        # Minimum guaranteed CPU (0.25 core)

          memory: "256Mi"    # Minimum guaranteed memory

        limits:

          cpu: "500m"        # Maximum CPU (0.5 core)

          memory: "512Mi"    # Maximum memory
Key Differences Between Requests and Limits
How Requests and Limits Affect Resource Planning
When allocating resources to your Kubernetes cluster, you need to balance the CPU and memory requirements across the nodes you add to the cluster. Typically, you will have fewer, larger nodes with significant CPU and RAM resources, or many smaller nodes (a mix is also possible, but not ideal, as addressed later in this article). Unbounded containers may consume significant resources, resulting in performance and stability issues across your cluster. If you know the amount of CPU and memory any given container needs to run, and set the requests to these amounts, you will be able to calculate the type and number of nodes you need in your cluster.
Spend less time optimizing Kubernetes Resources. Rely on AI-powered Kubex - an automated Kubernetes optimization platform
Free 30-day TrialHow Kubernetes Uses Requests and Limits
Every workload in Kubernetes has a lifecycle: from creation as an object, to scheduling onto a node as a running Pod, where its operation is monitored and enforced, to its eventual termination and deletion. Understanding and setting your Kubernetes resources vs limits within your environment will have a significant impact.
Note: In all cases, Pods with requests and limits share their values as a sum across all their containers; in other words, the sum of CPU and memory used by all the containers cannot exceed the limits imposed by the Pod. This is also true of namespaces.
The Scheduling Process
When you deploy a workload on Kubernetes, it is passed to the built-in scheduler, kube-scheduler. The scheduler continually reviews unscheduled containers and attempts to place them on running nodes. It employs a two-phase selection process to choose the target node for each Pod, consisting of filtering and scoring:
- Filtering scans (a subset of) the nodes in the cluster to determine which can run the Pod, considering its specific needs and excluding nodes that lack sufficient resources. Resulting nodes are called feasible nodes. Compute resources are always evaluated, and request values are critical; the sum of all requests for the containers in a Pod must be less than the node’s capacity for it to be feasible. Limits are not considered when selecting feasible nodes. Additional metrics typically evaluated include whether the image is already cached on the node, the Pod’s affinity and anti-affinity rules, and the status conditions (known as taints) flagged on the node. The size of the cluster and optimization settings affect which subset of nodes is filtered.
- Scoring considers the specific capabilities and available resources of each feasible node against a set of predefined criteria (13 default criteria), assigning a weight to each criterion to calculate a total score for that node. Ultimately, the node with the highest score is selected to run the Pod.
Quality of Service (QoS) Classes
Kubernetes examines the request and limits for each Pod and automatically assigns a Quality of Service (QoS) class that determines how it is initially scheduled and how it is affected when resources come under pressure on the node once it is running.
Guaranteed Class
When the request compute values are the same as the limit values [request = limit] for every container in the Pod.
These Pods have the highest chance of being scheduled and the least chance of being evicted when their node is under stress.
This is the best configuration option for:
- critical workloads
- workloads that will not benefit from spare resource capacity
- stable, long-term workloads
Example:
resources:

  requests:

    cpu: "500m"

    memory: "256Mi"

  limits:

    cpu: "500m"

    memory: "256Mi"
Burstable Class
When at least one container in the Pod has either a request lower than its limit, or no requests or limits assigned.
These Pods are guaranteed the requested resources and may ‘burst’ up to the assigned limit if the node has free capacity; however, they may be evicted during memory pressure.
This is the best configuration for:
- variable workloads
- short-term workloads
- workloads that can benefit from spare resource capacity
Example:
resources:

  requests:

    cpu: "200m"

    memory: "128Mi"

  limits:

    cpu: "500m"

    memory: "512Mi"
BestEffort Class
When no requests or limits are assigned to any container in the Pod.
These Pods can be scheduled to almost any node, even those with limited available capacity, but may be heavily CPU-throttled and are the first to be evicted when the node comes under pressure.
This is the best configuration for:
- batch jobs
- very short-lived workloads
You should avoid deploying BestEffort QoS Pods in production because, although they can be scheduled to almost any node, they are likely to consume more resources than the node has available, triggering the OOM Killer, which may disrupt more than one Pod and introduce instability into your workloads.
Eviction priority for workloads when a node is under stress is as follows:
- 1st, BestEffort Pods
- 2nd, Burstable Pods
- 3rd, Guaranteed Pods, which will only be evicted as a last resort
Runtime Resource Enforcement
Kubernetes passes resource requests and limits to the kernel on the node where the container is scheduled to run, and the kernel manages and enforces them. On Linux (the most likely node OS), containers are created in cgroups, a sophisticated kernel-level resource-isolation and control mechanism.
Containers will not be evicted due to CPU pressure; instead, they will be throttled according to their request values and priority. The kernel utilizes its Completely Fair Scheduler (CFS) to measure CPU utilization and prevent containers from exceeding their set limits; unbound containers will continue to consume as much spare CPU capacity as is available. The QoS class of a container sets the cpu-weight for the cgroup, which determines its priority. If a container has nothing to do, it consumes no CPU capacity. Throttling occurs when the kernel allocates less CPU capacity to a container than it could consume. Containers with CPU requests are guaranteed that amount of CPU capacity if they can consume it, and the kernel will ‘steal’ CPU capacity from lower-priority containers if required by throttling them. Likewise, Containers with CPU limits will be stopped from consuming any CPU capacity once they hit that limit, even if this leaves the processing cores idle. Throttling occurs only when the node is under pressure; in other words, if there is more than enough CPU capacity for all the containers to run at their limits on the node, then they all get to consume what they need.
The kubelet manages memory contention on the node by evicting Pods as needed to free up resources, doing so in a graceful manner whenever possible. However, memory utilization is ultimately enforced by the kernel. The amount of memory a container can consume is constrained by its assigned limit; unbound containers can consume all the RAM available on the node. If a container attempts to allocate more memory than its assigned limit, the OOMKiller is immediately invoked in the container’s cgroup, which kills the container and raises an OOM (out-of-memory) condition. If the kernel reaches a set memory pressure event, it invokes the OOMKiller across the node. On invocation, OOMKiller reviews all containers running on the node, reads their oom_score values, and kills one or more of them until memory pressure is alleviated. The QoS class of a Pod adjusts the oom_score_adj of each container, thereby preserving the eviction priority chain as much as possible. In any case, if a container is OOMKilled, the kubelet can restart it based on its restartPolicy.
Starting with Kubernetes v1.34, you can configure kubelet to collect Linux kernel Pressure Stall Information (PSI) for CPU, RAM, and I/O, which you can use to see how often, when, and for how long containers are held up waiting for resources.
The easiest way to identify throttled Pods is by using Prometheus, for which Kubernetes natively generates the container_cpu_cfs_throttled_seconds_total metric. Using kubectl alone, you cannot specifically identify throttled Pods, but you can get an approximation by checking for CPU saturation:
kubectl top pods -A | awk '$3 ~ /m$/ && $3+0 > 90 {print $0}'
Identifying killed Pods is much easier, as these events are explicitly recorded in the Pods’ status and logs. For instance, you could simply use:
kubectl get pods -A | grep -i oomkilled
Best Practices for Setting Requests and Limits
Paying attention to your Kubernetes requests vs limits will help to optimize and make your deployments more stable. Here we present some practical guidelines based on real production scenarios.
Determining Optimal Values
The key to achieving the optimal balance of performance, stability, and efficiency is identifying the optimal values for requests and limits for each of your containers, Pods, and namespaces.
Monitoring-based approach:
The most effective way to calculate Kubernetes requests vs limits is to monitor your workloads in the cluster during their operation. You should have some idea of the base requirements for each workload from its developers or vendors, which you can use as a starting point, at least for requests. Set each new workload you deploy as burstable during its initial deployment and use monitoring tools such as Prometheus to analyze its actual compute resource consumption. Monitoring the workload over several days of operation will provide a history of how it behaves during changes in demand; ensure you cover all the different periods of activity you anticipate it will encounter.
Once you have a time series of CPU and memory consumption data for each container, you can assign accurate request and limit values. Selecting the P95 value for requests and limits based on the recorded data will enable your containers to deliver optimal performance for 95% of the encountered workload patterns. However, you may end up reserving more resources than strictly necessary for much of their lifecycle. This is a good strategy for long-lived, stateful, or critical containers. Setting the values to the average of the observed metrics would reserve fewer resources and deliver optimal performance for at least half of the workload patterns. This may leave your containers vulnerable to unexpected peak demands, which could be mitigated by allowing more replicas to be generated during periods of high load. This is a good strategy for short-lived or low-priority containers. Examining the metics history for extreme outliers will help you to choose the best approach for each situation.
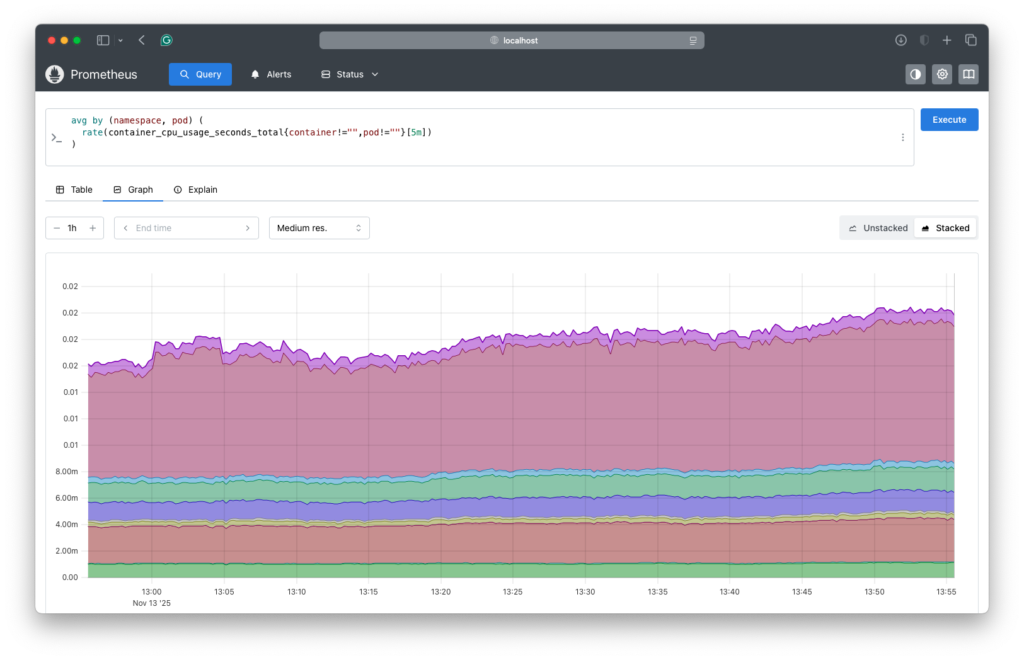
Here is a Prometheus query to find the average CPU usage per Pod and an example of the results:
avg by (namespace, pod) (

  rate(container_cpu_usage_seconds_total{container!="",pod!=""}[5m])

)
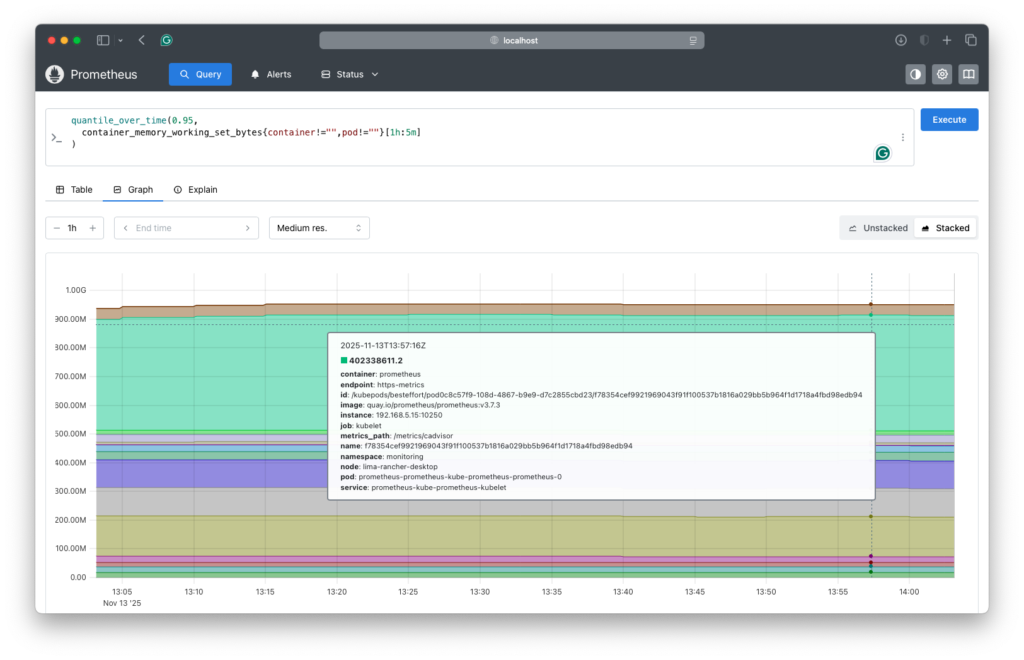
Here is a Prometheus query to find the P95 memory usage per pod and an example of the results:
quantile_over_time(0.95,

  container_memory_working_set_bytes{container!="",pod!=""}[1h:5m]

)
Load testing methodology:
In times of undue, unplanned, excessive load, possibly caused by a wildly successful product launch or a celebrity unexpectedly recommending your site to their millions of followers, it is imperative to remain functional even as performance degrades. To ensure your resources and limits are set effectively, you should perform stress testing procedures, using artificial load generators to increase demand on the system in a controlled manner. Monitor the environment for out-of-resource evictions and terminations, as well as application response times. During these tests, add further stress by simulating involuntary disruptions, such as deliberately killing containers or turning off nodes. You may notice that reducing limits during times of stress can maintain stability at the expense of performance.
When load testing, you may find unexpected changes in resource consumption; for example, you may discover that one container suddenly consumes significantly more RAM when the replicas of another, related container are increased. By identifying resource patterns, you can plan appropriate requests and limits for containers to be applied under specific conditions. For instance, when replicas of a front-facing container exceed a threshold, reset the requests and limits for their service containers to higher values, and then adjust them as the load eases. Remember to set your pod disruption budgets appropriately to account for Pod restarts to take on the new values.
VPA recommendations:
Another tool in your arsenal for setting your Kubernetes requests vs limits is the VPA (Vertical Pod Autoscaler) set to recommendation mode. As it analyzes the last rolling 8-days of CPU and memory usage for each container, it details the changes it would make to optimize its requests and limits in the status field of the VPA object. By querying its recommendations over time, you can build a picture of how VPA would set the requests and limits for each container to optimize its performance and stability as loads change. You can graph these data to obtain P50 and P95 values and compare them to your own metrics to identify potential changes you would make.
Request and Limit Ratios
CPU configurations:
CPU resources can be overallocated without causing out-of-resource kills or evictions, but throttling can severely impact performance. For this reason, we recommend a 1:1 ratio for high-performance or latency-critical workloads. For general production workloads, ratios of 1:1.5 to 1:2 are often employed. These can be expanded up to 1:4 for development and test workloads where performance is not critical, and resource cost is more important.
Memory configurations:
Memory resources can also be overcommitted, but unlike with CPU, RAM cannot be throttled, and containers exceeding their limit will be terminated. We recommend a 1:1 ratio for memory requests vs limits for all high-performance, critical, and low-latency workloads. These can reasonably be expanded to 1:1.2 for most general production workloads, which gives a good balance of reliability and efficiency. For development and test, the ratio can even be extended to 1:1.5. Containers without limits should be avoided unless they are short-lived, stateless, and resilient to unexpected terminations.
Environment-Specific Strategies
The programming language used to code the workload can significantly impact its behavior in containers. The following table shows recommendations for non-critical workloads coded in common languages:
| Language | CPU Ratio | Memory Ratio | Notes |
|---|---|---|---|
| Go | 1:1.5 | 1:1.1 | Very predictable |
| Rust | 1:1.25 | 1:1.05 | Most efficient |
| Java/Scala | 1:2–1:3 | 1:1.3–1.5 | JVM needs headroom |
| Node.js | 1:2 | 1:1.3 | V8 memory spikes |
| Python | 1:2 | 1:1.2–1.3 | Fragmentation |
| Ruby | 1:2 | 1:1.4–1.6 | Memory growth over time |
| .NET | 1:1.5–2 | 1:1.2–1.3 | Balanced GC |
| C++ | 1:1.25 | 1:1.1 | Statically allocated, predictable |
Consider using burstable Pods for workloads that can benefit from spare capacity on the node but can tolerate involuntary disruptions, such as batch jobs. To keep a lid on resource costs, you can use namespace limits for burstable Pods.
Avoid deliberately setting low request values in the hope that they will be scheduled more readily, as this leads to unstable environments.
Common Problems and Troubleshooting
When setting Kubernetes requests vs limits in the real world, operators have developed solutions to address many issues they have encountered. Here we review some of the most common ones.
CPU Throttling Issues
Identifying that performance is being hampered by CPU throttling can be challenging at times. The most common symptom is that your containers are performing worse than anticipated; however, a more insidious symptom is when a container appears to be performing okay but is well below what it is capable of. The only way to ensure that workloads are being throttled is through monitoring. Luckily, Kubernetes collects a specific metric, container_cpu_cfs_throttled_seconds_total, that Prometheus can query to identify throttled containers. To find the throttling percentage for each Pod in your namespace, you can use the following Prometheus query:
100 *

(

  rate(container_cpu_cfs_throttled_seconds_total{container!="",pod!=""}[5m])

/

  rate(container_cpu_usage_seconds_total{container!="",pod!=""}[5m])

)
It is common for containers to be throttled up to 5% of the time, which helps reduce overall costs by overcommitting resources. Any containers throttled between 20% and 50% are likely experiencing performance degradation. Any being throttled more than 50% of the time are severely limited and indicates that their limits are too low (if this is a guaranteed QoS Pod, the request value is too low, too).
A simple way to find the correct limit for a container is to remove its current limit and run it unbound, whilst monitoring its CPU usage. Once you see its natural limit, set that value as its new limit. Monitor its actual task performance at the same time: if it doesn’t do its work appreciably quicker when not being throttled, or if it consumes vast amounts of unexpected CPU resources without dramatically improving its throughput, then it’s likely a coding bottleneck or bug.
Look out for noisy neighbors. It may be better to add replicas of the container and scale them horizontally across more nodes to reduce contention with locally adjacent workloads. In extreme cases, you can use anti-affinity rules to ensure that contentious containers are kept apart.
Memory-Related Problems
OOMKilled pods:
The most serious memory-related issue occurs when the kernel terminates containers immediately using the OOM Killer. Although such containers can be restarted locally on the same node by the kubelet, the work they were doing will be lost, which causes performance issues or user irritation. If a node is under memory pressure, the kubelet will attempt to evict low-priority Pods to schedule new, high-priority ones. These evictions are graceful, which means the Pods have time to finish their current tasks before being terminated.
Sticking with Prometheus as our query tool, the following query will identify containers terminated by OOMKiller:
kube_pod_container_status_last_terminated_reason{

  reason="OOMKilled"

}
This query will identify Pods that were evicted owing to memory pressure:
kube_pod_status_reason{

  reason="Evicted",

  message=~".*memory.*"

}
You can determine whether an OOMKilled event occurred due to insufficient limits or memory leaks by analyzing the container’s memory usage patterns. Clues to memory leaks include whether the allocated memory keeps growing over time rather than under workload pressure, and whether the OOMKilled event occurs after the same duration after the container starts. The most reliable way to empirically test for insufficient limits is to increase the limit by 20-30% increments; if the OOMKilled events cease, then you have found the appropriate limit: if they never stop, you have a memory leak.
A Prometheus query that provides a strong indicator of memory leaks is to check if the rate of memory growth is consistently positive:
rate(container_memory_working_set_bytes[15m])
Memory pressure and evictions:
Out-of-resource evictions differ from OOMKiller events; they are detected and managed by Kubernetes itself rather than by the node kernel. When a node reaches pre-defined low-memory limits (evictionHard, evictionSoft), the kubelet takes direct action to preserve the node’s viability. It first marks the node as under pressure [memoryPressure = True] so that the scheduler excludes it from its feasible filter phase. If the evictionSoft limit is exceeded for longer than the evictionSoftGracePeriod, or if the evictionHard limit is reached, the kubelet starts evicting running Pods from the node to recover sufficient resources to remain viable.
The kubelet uses the Pods’ QoS class to determine the order in which to evict them. First are BestEffort, second are Burstable. Only if the evictionHard limit is reached and the eviction of lesser priority Pods cannot bring the memory below the evictionSoft limit, then even Gauranteed Pods are evicted to ensure the survival of the node.
The key to setting eviction limits is to balance the likelihood that nodes will rapidly exceed their soft limit against the efficient use of resources. Typical production values for these limits in nodes with 8-64GiB RAM are:
evictionHard:

  memory.available: "250Mi"

evictionSoft:

  memory.available: "750Mi"

evictionSoftGracePeriod:

  memory.available: "1m"

evictionPressureTransitionPeriod: "30s"
Here is a table showing the differences between OOMKilled events and out-of-resource evictions:
| Behavior | Container OOMKilled | Pod Eviction (OOM) |
|---|---|---|
| Trigger | Container exceeds memory limit | Node is running out of memory |
| Who kills it? | Linux OOM Killer | Kubelet eviction manager |
| What dies? | One container | Entire pod |
| Signal | SIGKILL (no grace) | SIGTERM → graceful |
| Restarted? | Yes, container restarts | No, pod is deleted (unless replicas manage it) |
| Status | OOMKilled | Evicted |
Scheduling Failures
When you deploy a workload into your cluster, the scheduler will continually attempt to schedule the Pods until it finds a suitable node. If the scheduler cannot find feasible nodes for a Pod, it will mark its status accordingly. In the example below, the scheduler has been unable to find nodes with either enough CPU or memory, and this Pod will remain in the queue until it does. If a request exceeds the capacity of any node, it will never be scheduled and will remain in the queue indefinitely.
PodScheduled: False

   Insufficient cpu

   Insufficient memory
If a Pod is scheduled but quickly consumes more resources than its node has available, it will experience stability issues or be evicted; in the worst case, this affects other Pods on the node as well. This is why it is never a good idea to “low-ball” the requests for a container in the hope that it gets scheduled more quickly/readily.
It is essential to accurately set your Kubernetes requests vs limits for your containers and ensure that the cluster has adequate capacity to support them. If you determine that there are not enough resources in the cluster to support your workloads, you need to either add more resources or decide which of your workloads can be sacrificed for the benefit of the others.
To make the scheduler most effective in its work, ensure that all the nodes in a node pool are identical. This will speed the scheduling of Pods and reduce the likelihood of resource wastage or over-contention: note that this is a requirement when using cluster autoscalers.
Monitoring and Alerting
As Kubernetes is a shared infrastructure by design, some expected contention and periods of high usage can be anticipated. Therefore, when defining your alerts and dashboards, we suggest using rate-based metrics, as they show impact over time and are more helpful for identifying trends than specific instances. Below are some sample Prometheus alerts we recommend to help monitor key resource utilization:
Containers being throttled more than 30% for over 5 minutes (which will almost certainly be causing a performance/latency impact):
- alert: ContainerHighCPUThrottling

  expr: |

    rate(container_cpu_cfs_throttled_periods_total[5m])

    /

    rate(container_cpu_cfs_periods_total[5m])

    > 0.30

  for: 5m

  labels:

    severity: critical

  annotations:

    summary: "High CPU throttling on container {{ $labels.container }}"

    description: |

      Container {{ $labels.container }} in pod {{ $labels.pod }} is being throttled more than 30%.

      This means the CPU limit is too low, causing CFS throttling and performance degradation.
All the Pods combined on a node are being throttled by more than 20% for over 5 minutes (which indicates either limits are too low or the node needs more CPU resources):
- alert: NodeHighCPUThrottling

  expr: |

    sum(rate(container_cpu_cfs_throttled_periods_total{container!="", pod!=""}[5m]))

    /

    sum(rate(container_cpu_cfs_periods_total{container!="", pod!=""}[5m]))

    > 0.20

  for: 5m

  labels:

    severity: warning

  annotations:

    summary: "Node-level CPU throttling"

    description: |

      Node {{ $labels.instance }} has >20% CPU throttling across all containers.

      This suggests CPU limits are too restrictive or workloads are CPU-bound.
Nodes under memory pressure (which means the node is either in the grace period or actively evicting Pods):
groups:

- name: node-memory-pressure

  rules:

  - alert: NodeMemoryPressure

    expr: kube_node_status_condition{condition="MemoryPressure", status="true"} == 1

    for: 2m

    labels:

      severity: warning

    annotations:

      summary: "Node is under memory pressure"

      description: "The kubelet has detected memory pressure on node {{ $labels.node }}. Pods may soon be evicted."
Continuous OOMKills (which indicates limits are too low, node RAM is too small, or possible memory leaks:
- alert: ContainerOOMKilled

  expr: increase(kube_pod_container_status_restarts_total{reason="OOMKilled"}[5m]) > 0

  labels:

    severity: critical

  annotations:

    summary: "Container was OOMKilled"

    description: "Pod {{ $labels.pod }} on node {{ $labels.node }} was OOMKilled. This may indicate node memory pressure or a container memory leak."
High memory usage (alerts before node becomes under pressure):
- alert: NodeHighMemoryUsage

  expr: (node_memory_MemTotal_bytes - node_memory_MemAvailable_bytes)

        / node_memory_MemTotal_bytes > 0.90

  for: 10m

  labels:

    severity: warning

  annotations:

    summary: "Node memory usage over 90%"

    description: "Node {{ $labels.instance }} is using more than 90% of its memory."
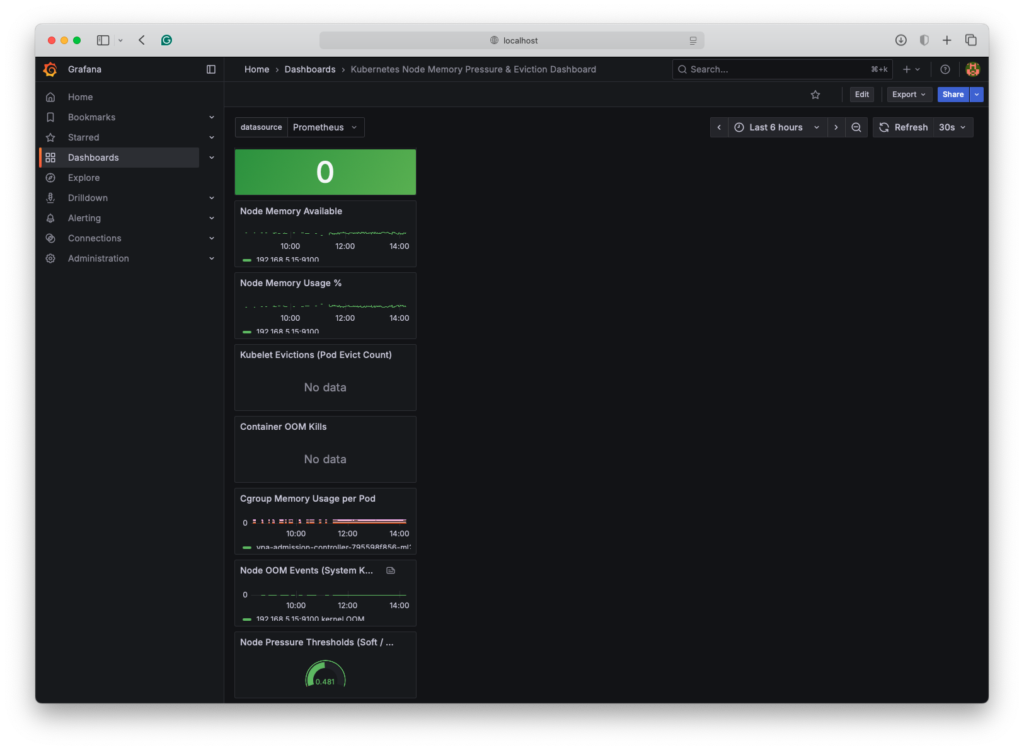
Here is an example Grafana dashboard JSON code that will visualize node memory pressure, eviction risk, and OOM signals for your cluster:
{

  "annotations": {

    "list": [

      {

        "builtIn": 1,

        "datasource": "-- Grafana --",

        "enable": true,

        "hide": true,

        "iconColor": "rgba(0, 211, 255, 1)",

        "name": "Annotations & Alerts",

        "type": "dashboard"

      }

    ]

  },

  "editable": true,

  "gnetId": null,

  "graphTooltip": 0,

  "panels": [

    {

      "title": "Node Memory Pressure (Kubelet)",

      "type": "stat",

      "id": 1,

      "datasource": "$datasource",

      "targets": [

        {

          "expr": "kube_node_status_condition{condition=\"MemoryPressure\", status=\"true\"}",

          "legendFormat": "{{node}}",

          "refId": "A"

        }

      ],

      "options": {

        "reduceOptions": {

          "calcs": ["lastNotNull"]

        },

        "orientation": "horizontal",

        "colorMode": "background",

        "graphMode": "none"

      }

    },

    {

      "id": 2,

      "type": "timeseries",

      "title": "Node Memory Available",

      "datasource": "$datasource",

      "targets": [

        {

          "expr": "node_memory_MemAvailable_bytes{instance=~\".*\"} / 1024 / 1024 / 1024",

          "legendFormat": "{{instance}}",

          "refId": "A"

        }

      ],

      "fieldConfig": {

        "defaults": {

          "unit": "GB"

        }

      }

    },

    {

      "id": 3,

      "type": "timeseries",

      "title": "Node Memory Usage %",

      "datasource": "$datasource",

      "targets": [

        {

          "expr": "(node_memory_MemTotal_bytes - node_memory_MemAvailable_bytes) / node_memory_MemTotal_bytes * 100",

          "legendFormat": "{{instance}}",

          "refId": "A"

        }

      ],

      "fieldConfig": {

        "defaults": {

          "unit": "percent"

        }

      }

    },

    {

      "id": 4,

      "type": "timeseries",

      "title": "Kubelet Evictions (Pod Evict Count)",

      "datasource": "$datasource",

      "targets": [

        {

          "expr": "increase(kube_pod_evict_total[5m])",

          "legendFormat": "{{pod}}",

          "refId": "A"

        }

      ]

    },

    {

      "id": 5,

      "type": "timeseries",

      "title": "Container OOM Kills",

      "datasource": "$datasource",

      "targets": [

        {

          "expr": "increase(kube_pod_container_status_restarts_total{reason=\"OOMKilled\"}[5m])",

          "legendFormat": "{{pod}} / {{container}}",

          "refId": "A"

        }

      ]

    },

    {

      "id": 6,

      "type": "timeseries",

      "title": "Cgroup Memory Usage per Pod",

      "datasource": "$datasource",

      "targets": [

        {

          "expr": "sum by (pod, container) (container_memory_working_set_bytes)",

          "legendFormat": "{{pod}}/{{container}}",

          "refId": "A"

        }

      ]

    },

    {

      "id": 7,

      "type": "timeseries",

      "title": "Node OOM Events (System Kernel OOMs)",

      "datasource": "$datasource",

      "targets": [

        {

          "expr": "increase(node_vmstat_oom_kill[10m])",

          "legendFormat": "{{instance}} kernel OOM",

          "refId": "A"

        }

      ]

    },

    {

      "id": 8,

      "type": "gauge",

      "title": "Node Pressure Thresholds (Soft / Hard)",

      "datasource": "$datasource",

      "targets": [

        {

          "expr": "node_memory_MemAvailable_bytes / node_memory_MemTotal_bytes",

          "legendFormat": "{{instance}}",

          "refId": "A"

        }

      ],

      "fieldConfig": {

        "defaults": {

          "min": 0,

          "max": 1,

          "thresholds": {

            "mode": "percentage",

            "steps": [

              { "color": "red", "value": 0.1 },

              { "color": "orange", "value": 0.2 },

              { "color": "green", "value": 0.5 }

            ]

          }

        }

      }

    }

  ],

  "schemaVersion": 36,

  "templating": {

    "list": [

      {

        "name": "datasource",

        "type": "datasource",

        "query": "prometheus",

        "current": { "text": "Default", "value": "default" }

      }

    ]

  },

  "title": "Kubernetes Node Memory Pressure & Eviction Dashboard",

  "version": 1,

  "refresh": "30s"

}
This dashboard will look like this once imported:
Advanced Configuration and Optimization
Once you have mastered the differences between Kubernetes requests vs limits, you are ready to take control of your deployments and take your resource management to the next level.
Namespace-Level Controls
Namespaces are not just a way to organize your workloads into departments or organizations; they are a means to isolate workloads from one another, ensure that similar types of containers are constrained, or allocate critical workloads all the resources they need, regardless of the situation. For example, production and development namespaces. You can give all the resources required for production to maintain full performance, whilst having development workloads share whatever resources are left over. Similarly, you could ensure that in the event of unanticipated load, the front-end app containers have the necessary resources to replicate massively, at the expense of lower-priority tasks such as routine accounting.
Resource quotas are a mechanism for setting the resource limits for all containers in a namespace. In our example, you could set the production namespace ResourceQuota limits to 90% of the node pool resources, ensuring that they can replicate and utilize up to 90% of the available resources when demand requires it. During periods of normal load, the remaining namespaces would be able to use the unused capacity.
You can use LimitRanges to set sensible default requests and limits for unbound Pods that are scheduled for deployment. Any container that does not have specific requests and limits assigned will be subject to the LimitRanges. In this way, you can ensure that containers do not consume more resources than planned, even within a namespace with ResourceQuotas.
Here is an example of setting realistic compute ResourceQuotas and LimitRanges for Production and Development namespaces sharing the same node pool.
Production ResourceQuota:
apiVersion: v1

kind: ResourceQuota

metadata:

  name: prod-compute-quota

  namespace: production

spec:

  hard:

    requests.cpu: "40"

    requests.memory: "120Gi"

    limits.cpu: "80"

    limits.memory: "240Gi"
Production LimitRange:
apiVersion: v1

kind: LimitRange

metadata:

  name: prod-limit-range

  namespace: production

spec:

  limits:

  - type: Container

    defaultRequest:

      cpu: "250m"

      memory: "512Mi"

    default:

      cpu: "1"

      memory: "2Gi"

    min:

      cpu: "100m"

      memory: "256Mi"

    max:

      cpu: "4"

      memory: "8Gi"
Development ResourceQuota:
apiVersion: v1

kind: ResourceQuota

metadata:

  name: dev-compute-quota

  namespace: development

spec:

  hard:

    requests.cpu: "8"

    requests.memory: "16Gi"

    limits.cpu: "16"

    limits.memory: "32Gi"
Development LimitRanges:
apiVersion: v1

kind: LimitRange

metadata:

  name: dev-limit-range

  namespace: development

spec:

  limits:

  - type: Container

    defaultRequest:

      cpu: "100m"

      memory: "256Mi"

    default:

      cpu: "500m"

      memory: "1Gi"

    min:

      cpu: "50m"

      memory: "128Mi"

    max:

      cpu: "2"

      memory: "4Gi"
Automation Tools and Solutions
To really take advantage of all the facilities afforded by Kubernetes to workload and resource management, you can deploy automation tools that can either augment the manual monitoring and configuration of request and limit sizes, or even completely automate it.
Vertical Pod Autoscaler (VPA):
When a single container can accomplish significantly more work with additional resources, it is a good candidate for vertical scaling. We’ve already mentioned the VPA to provide insight into your workload requests and limits, but it can also automate rescaling those requests and limits for chosen containers. Once enabled, VPA will set the requests and limits for your containers based on the most recent of rolling 8-day samples. As of Kubernetes v1.35, VPA does not support resizing pods in-place, so pods are restarted to change their request and limit values and may end up on different nodes (the worst-case scenario is that there are no nodes with sufficient resources to schedule the resized pods). VPA maintains a fixed ratio between requests and limits across all pods, so it does not adapt to workload characteristics, which can affect resource optimization. VPA must not be used to autoscale CPU workloads in conjunction with HPA, as this causes thrashing.
Some configuration best practices for VPA are:
- Always start in Recommendation mode as previously discussed.
- Avoid automating latency-sensitive workloads.
- Avoid automating critical, stateful workloads to minimize disruption.
- Automation is suitable for batch jobs that can benefit from spare resources, stateless workload replicas, and other workloads that are frequently restarted in regular operation.
- Automation may be beneficial for steady-state workloads with predictable, non-bursty loads, such as JVMs, microservices, and controllers.
Horizontal Pod Autoscaler (HPA):
If a container is one of several copies of a single workload, it is a good candidate for horizontal scaling, in which we create more replicas on demand based on the current load. HPA can automatically create, schedule, and delete replicas of pods across your node pool to meet specified goals. For example, if a pod is over 60% utilized, create a replica; if it is under 20% utilized, destroy a replica if more than the minimum number exist.
Note: You must not combine VPA and HPA for CPU scaling workloads.
There are four resource-based HPA triggers you can configure. We present a table below with recommendations on their use.
| Metric | Measures | Scales On | Best For |
|---|---|---|---|
| CPU Utilization | CPU % of requests | Sustained CPU load | APIs, compute workloads |
| Memory Utilization | Memory % of requests | Memory pressure | JVM, caching apps, leaks |
| AverageValue (CPU) | Absolute CPU usage | Over fixed threshold | Multi-tenant apps |
| AverageValue (Memory) | Absolute memory usage | Fixed memory footprint | Predictable workloads |
Third-party tools:
Once your Kubernetes environment grows beyond a few nodes and several workloads, the resource costs associated with running them can start to escalate. Soon, the human workload of monitoring and scaling the pods using the built-in tools becomes onerous and error-prone. Fortunately, there are several third-party tools designed to replace basic tools with more advanced counterparts or to add completely new capabilities.
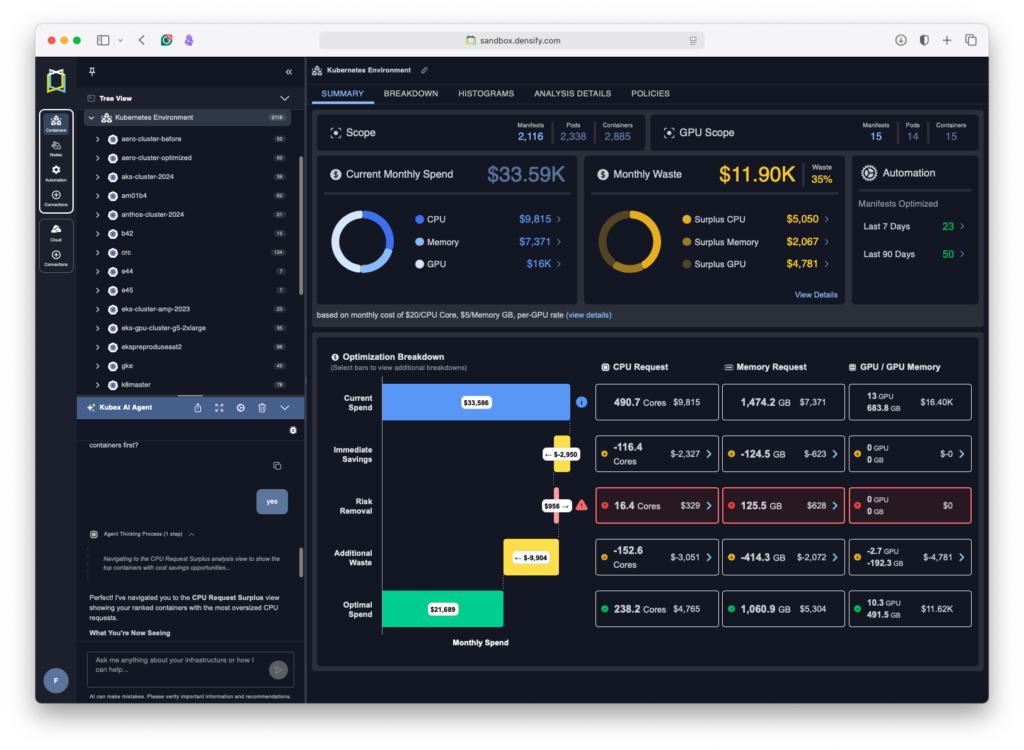
For users with increasingly complex or large Kubernetes environments who want to take control of their service costs and improve workload reliability and performance, Kubex is an ideal tool. Right out of the box, Kubex will plug into your Kubernetes metrication services and start to analyze your environment’s operational history. It will use its machine learning capabilities to identify patterns in utilization and recommend actions to reduce your service costs and improve the reliability of your workloads. You can use the extensive analysis tools to examine almost any metric, such as identifying which containers are or have been throttled, which are being impacted by OOMKills, or which have far too much memory allocated. You can make recommended changes to your environment to see the effect and monitor the results until you are comfortable with the process. When you are ready, you can instruct Kubex to automatically apply its learned recommendations to your Kubernetes cluster via its native Mutating Admission Controller, which dynamically adjusts the requests and limits of your containers to match their calculated targets, anticipating future events based on historical trends. Of note is the safety feature built into the automation, whereby Kubex performs dry runs of the Kubernetes scheduler before it changes the requests and limits for a container to ensure there is a feasible node for the newly sized container.
Taking advantage of the latest developments, Kubex offers an AI Agent you can ask about almost anything related to your environment; it also shows the results of your questions in the data, automatically displaying the relevant view in the UI. A key safety aspect of this AI Agent is that, even though it can answer your questions, help with your analysis, and activate automation features, it is only acting as an assistant. To ensure hallucinations are not introduced into the results, the values for automation and other actions are generated independently by the tried-and-tested machine learning facility.
Multi-Container Pod Considerations
Multi-container Pods share their Pod’s requests and limits as an aggregate across all the containers. The combined request is the sum of all the containers’ requests, but the sum of the containers’ limits cannot exceed the Pod’s limit. The advantage of setting Pod requests and limits is that any container without explicit request and limit values will share whatever resources remain from containers that explicitly state their requirements.
Init containers are single-use containers in a Pod that run sequentially to completion before the app containers are started. When scheduled, the highest request value across all init containers in the Pod becomes the effective init request/limit. The Pod’s effective request/limit value is whichever is higher: the sum of all app container requests or the effective init request/limit. This means a Pod may end up reserving resources on the node that are never consumed.
Sidecar containers are special init containers that don’t run to completion. Once started, they follow the same lifecycle as the app containers; they can be started, stopped, and restarted without affecting the app containers. Sidecar container resources are treated the same as init containers for scheduling, meaning they share the Pod’s resources with the app containers according to the effective request/limit.
Here is a deployment example with one app container, one init container and one sidecar all sharing the same volume to pass data between them:
apiVersion: apps/v1

kind: Deployment

metadata:

  name: example-app

spec:

  replicas: 2

  selector:

    matchLabels:

      app: example-app

  template:

    metadata:

      labels:

        app: example-app

    spec:

      initContainers:

        - name: init-config

          image: busybox:1.36

          command:

            - sh

            - -c

            - |

              echo "Preparing configuration..."

              mkdir -p /workdir/config

              echo "initialized=true" > /workdir/config/ready.txt

          resources:

            requests:

              cpu: "50m"

              memory: "64Mi"

            limits:

              cpu: "100m"

              memory: "128Mi"

          volumeMounts:

            - name: workdir

              mountPath: /workdir


      containers:

        - name: main-app

          image: nginx:1.27

          ports:

            - containerPort: 80

          resources:

            requests:

              cpu: "200m"

              memory: "256Mi"

            limits:

              cpu: "500m"

              memory: "512Mi"

          volumeMounts:

            - name: workdir

              mountPath: /usr/share/nginx/html/config

              readOnly: true


        - name: sidecar-logger

          image: busybox:1.36

          command:

            - sh

            - -c

            - |

              echo "Sidecar logger starting..."

              tail -n+1 -F /workdir/app.log

          resources:

            requests:

              cpu: "50m"

              memory: "64Mi"

            limits:

              cpu: "100m"

              memory: "128Mi"

          volumeMounts:

            - name: workdir

              mountPath: /workdir


      volumes:

        - name: workdir

          emptyDir: {}
Spend less time optimizing Kubernetes Resources. Rely on AI-powered Kubex - an automated Kubernetes optimization platform
Free 30-day TrialConclusion
The critical differences when considering Kubernetes requests vs limits are:
- Requests set the minimum amount of resources needed to operate the container
- The scheduler uses requests to decide which node to place the container on, if anywhere
- Limits set the maximum amount of resources to be consumed by that container when running
- CPU limits may result in performance throttling: memory limits may result in OOMKills and restarts
Setting incorrect requests and limits can introduce performance issues and instability, not just for individual containers but for the cluster. Monitoring is the first step in measuring the correct requests and setting appropriate limits. Start by setting conservative memory limits (a small ratio of requests to limits) to avoid excessive resource consumption and unnecessary costs; gradually increase the limits until you have reduced OOMKills or node-under-pressure evictions to 95% or less. Allow containers to consume unused CPU resources if it will benefit them by making them Burstable class. Implement namespace-level controls to allow mixed environments to share the same cluster efficiently.
Once you have mastered Kubernetes requests vs limits, start removing human overhead and fallibility by implementing optimization tools. Unless your environment workload is entirely static, consider implementing a continuous optimization strategy. Learn how Kubex automatically optimizes your Kubernetes requests and limits based on actual usage patterns by visiting kubex.ai.
FAQ
Q1: Are there any differences between Windows and Linux nodes?
While Linux nodes use cgroups to enforce boundaries and resource limits between containers, Windows uses job objects. In practical terms, this means:
- Windows cannot guarantee a minimum amount of CPU time for containers
- Windows cannot run without pagefiles. Containers will not run out of memory, but the whole node will suffer performance degradation when it starts paging.
- There is no way to run privileged containers on Windows.
Q2: Can I just set the default requests and limits for each namespace and nothing else?
By setting only the defaults for requests and limits in each namespace, rather than in containers or Pods, you will end up with every container assigned the same QoS class in each namespace, thereby removing Kubernetes’s ability to prioritize them.
Q3: Should you use CPU limits in Kubernetes?
CPU limits help Kubernetes efficiently manage the actual workloads of different containers sharing the same nodes. Without limits, each container would just use all the CPU resources it can to get its work done, but the nodes would appear busy to the scheduler and thus unsuitable targets for new containers.
Q4: What happens if a Pod exceeds the CPU limit?
When a Pod exceeds its CPU limit, the containers within will be throttled according to their QoS class.
Q5: What are the limitations of native Kubernetes automation tools?
VPA uses only 8 days of historical data; it may not pick the right sizing for irregular events, such as monthly or quarterly ends or promotions, which can result in Pod evictions and restarts at inopportune times as it tries to adapt to changes. When VPA evicts Pods to accommodate new requests and limits, they may end up without a feasible node to reschedule to with those new request values. Such Pods will be stuck pending until enough resources are freed up. HPA and VPA must not be used to scale the same resource type; doing so will trigger a storm of restarts, causing severe instability.
Spend less time optimizing Kubernetes Resources. Rely on AI-powered Kubex - an automated Kubernetes optimization platform
Free 30-day TrialTry us
Experience automated K8s, GPU & AI workload resource optimization in action.
Try us
Experience automated K8s, GPU & AI workload resource optimization in action.